Introduction
The greatest risk to the economy is the extreme levels of pessimism regarding the prospects for the economy.1 If consumers stop spending and firms stop investing because they fear a recession, that could cause a recession.2 Sentiment can be self-fulfilling.
University of Michigan Index of Consumer Sentiment3
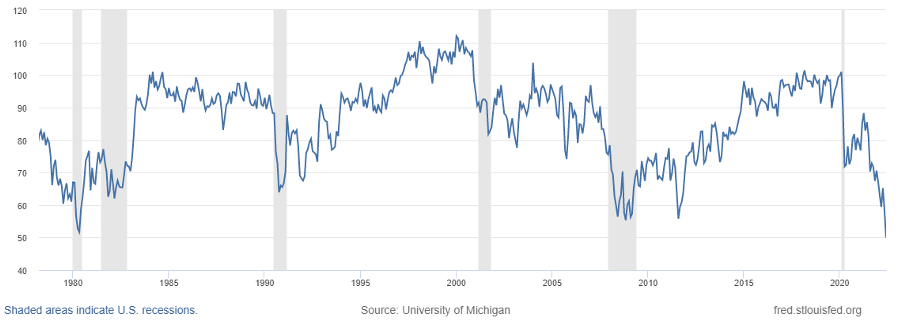
These levels of sentiment are at odds with data on economic conditions.
The labor market is extremely strong. The unemployment rate is at 50 year lows. While job openings have fallen (due in part to openings being filled from increased employment) the rate of job openings as a percentage of employment remains well above the levels seen prior to 2021. Profits as a fraction of GDP and as a fraction of hours worked are high, as are quit rates. The high rates of job openings, quit rates, and high profits of firms are likely to cause wages to continue to rise, increasing firm costs and increasing aggregate demand, both of which will lead to higher prices.
Financial conditions are also robust. Debt service payments as a fraction of disposable income are below historical levels. Delinquency rates on credit card debt are far below their historic averages, and are below any levels reached prior to the pandemic. Default rates on business loans are very low. Firms have high levels of retained earnings, and are continuing to make capital investments. The strong balance sheets of firms will cushion them against falls in demand. As discussed below, firms could be vulnerable to higher interest rates on loans; however taking everything into account, there does not seem to be the fragility in the economy that we would expect if the sentiment indicators in the Michigan consumer confidence survey reflected the actual conditions of the economy.4
Federal Reserve policies will be less effective than they have been in the past. Manufacturing and particularly motor vehicle production, as a fraction of employment, is much smaller than when the FED last tightened significantly. Along with residential construction, these are the main venues through which interest rates affect the economy. The “fly in the ointment” is the high levels of business loans to nonfinancial corporations—roughly $4.7 trillion dollars. These are likely to be variable interest rates loans and the borrowers could respond to higher interest rates by retrenching—reducing employment and cutting investment.
Low vacancy rates on homes and on rental properties, as well as the projected increases in household formations and the bruited supply shortage of housing may, in the short run, dampen the effect of higher interest rates on employment in the construction industry. Average rents are likely to continue to increase at a high rate as they catch up to the large increases in rents on new leases that we’ve seen in the last several quarters. The rents on new leases may themselves continue to increase as they gradually converge to their historical relationship to the cost of home ownership, which has increased much more than rents on new leases. On the other hand, the supply of partially completed homes may dampen pressure on home prices, while sustaining demand for furniture and appliances.
Thus, based purely on economic fundamentals, the likelihood of recession seems small. On the other hand, sentiment about the economy is at historic lows.5
Many of the same factors that point to a low probability of recession will make it difficult for the Fed to substantially reduce inflation. In addition to the high levels of labor demand, there is the embedded tailwind from the effect of average rents, which is a major component of CPI. Working in the opposite direction are the futures markets forecasts of falls in energy prices and commodities more generally, as well as a strong dollar lowering the cost of imported goods. I believe the net effect is that it will be very difficult for the Fed to reach its inflation target without either very high interest rates, or pessimistic sentiment itself causing a recession.
Continued Labor Market Tightness
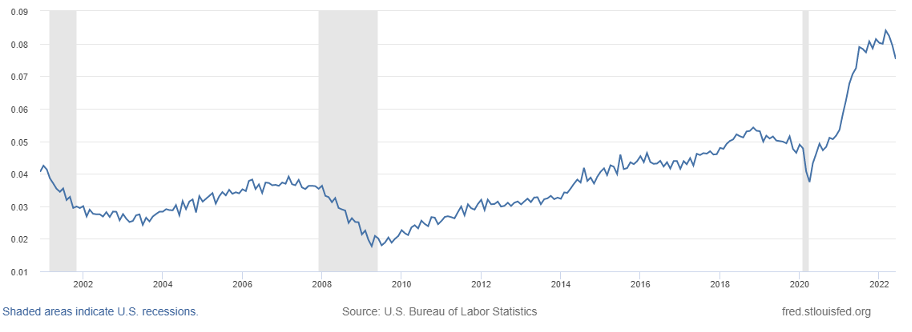
There has been considerable attention placed on limitations on the availability of some goods such as some models of motor vehicles, but there may also be supply constraints in services due to limited availability of workers causing limited hours of service or lower quality of service—which is a form of supply rationing. Most strikingly, the private sector job openings rate (the ratio of job openings to total employment) remains at very high levels, although it has fallen from its peak of 8.4%. It is 7.8% of the private sector work force, which is roughly twice its average going back to 2000, when data on job openings was first collected. Prior to January 2021, private sector job openings had never exceeded 5.4% of the labor force. The fall in job openings is somewhat less than might be expected from the increase in employment. In the years prior to the pandemic, private sector job openings were in the neighborhood of 5%.
Private Sector Job Openings as a Fraction of Private Employment6
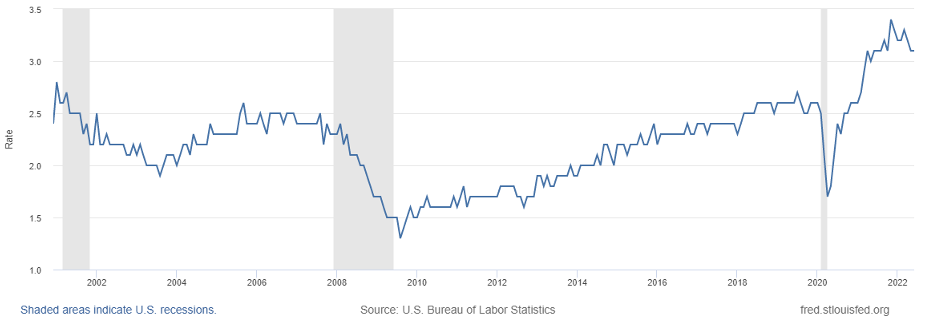
Private Sector Quit Rate7
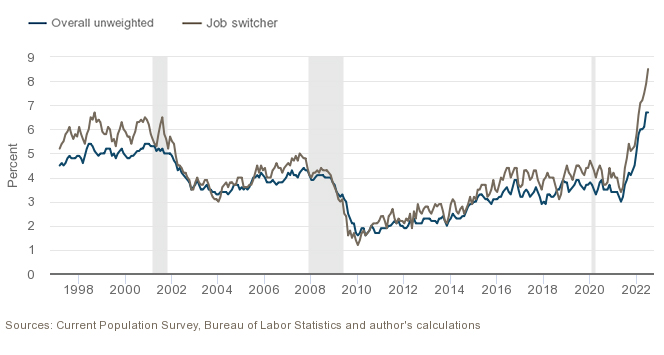
According to the Atlanta Fed, median wages for the panel of people they follow are around 6.7% higher in the last 3 months than in the same three month period a year ago. For job changers, the wage increase is 8.5%. While these are large increases relative to previous months, wages are still substantially lagging inflation.8
Three-Month Moving Average of Median Wage Growth, Hourly data9
These unfilled jobs could be reflected in an inability for restaurants to serve potential patrons. For example, spending in restaurants could be depressed by restaurants not having available seating or having shorter hours and being closed on more days due to labor shortages. Anecdotally, two Dunkin’ Donuts outlets in central Massachusetts did not have donuts on a recent weekend. In Martha’s Vineyard, the local newspaper is reporting restaurant closings during the prime vacation season due to lack of staff. Confirming evidence about sales being constrained by insufficient supply rather than insufficient demand comes from the high ratio of corporate profits to hours worked.
Normally, the volume of sales reflects demand—falls in sales is a measure of falls in demand, but we are not in normal conditions. We are in conditions in which supply in various sectors is being constrained either from shortages of parts, as in sales of motor vehicles and electronics, or shortages of workers—reflected in reduced hours for some service providers and reduced quality of service for airlines, hotels and other similar service providers. If sales are depressed due to insufficient supply, this should drastically change our interpretation of economic data. Rather than low sales being a harbinger of a recession, the low sales could reflect unsatisfied demand that will support demand in the face of what would otherwise be contractionary monetary policy. Thus, the economy may be less responsive to policies that depress demand than would normally be the case.
Additionally, unspent funds from the infrastructure bill, investment induced by the semiconductor bill, and the likely increase in defense spending in light of the activities of China and Russia are all likely to be putting additional pressure on demand for workers. Note that because of the high rate of job openings, even if there is a fall in labor demand in some sectors of the economy, the dismissed workers may enable firms that are suffering labor shortage to increase employment.
Despite increasing nominal wages, real wages have been falling, which has depressed consumer demand; this dampening effect on inflation is unlikely to persist.10 If firms increase the monetary compensation of workers in response to supply shortages, that would increase pressure on prices and increase demand due to the relatively high marginal propensity to consume of those workers.
Household Balance Sheets
While the stock market is down substantially this year, the average consumer (weighted by consumption) has most of their wealth in housing, not the stock market, and if we go back five years, stock markets have performed extremely well. Since the wealth effects on spending typically have long durations (the increase in wealth is spent over many years), the fall in the stock market would have its main effect through changes in sentiment (people may retrench their spending out of a fear of recession) rather than the direct effect of changes in wealth on spending. As discussed in the introduction, high levels of pessimism about the economy among consumers is the main reason we might experience a recession.
The media has reported increases in consumer debt. This is highly misleading. Credit card balances are down. What is up is mortgage debt and auto loans. This is a natural consequence of the increases in home prices and car prices. As opposed to credit card debt or student loans, these are collateralized loans. The high prices of homes and of used cars means that the collateral value is quite good. Borrowers could sell the assets if they needed cash. In addition, the credit ratings for borrowers have been higher than was historically the case.
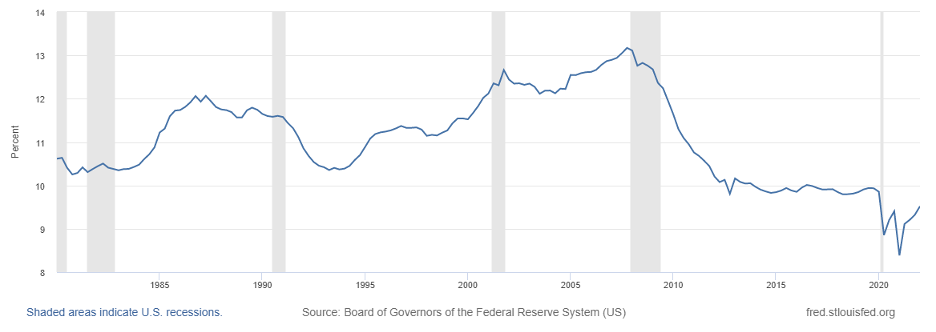
Household Debt Service Payments as a Percent of Disposable Income11
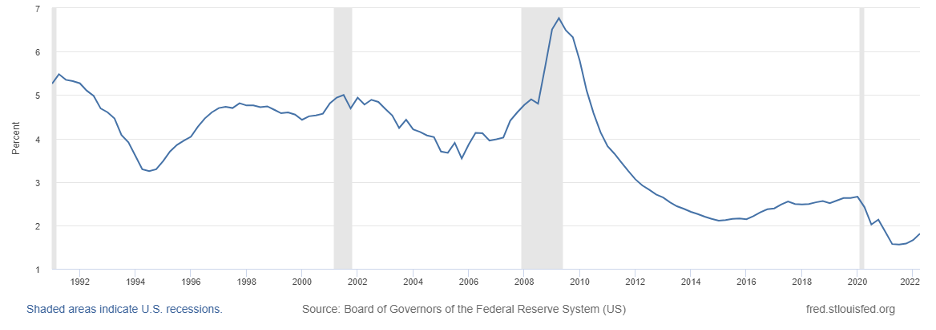
Delinquency Rate on Credit Card Loans12
Household debt service payments have not fallen as much as the fall in interest expense. This is because the increase in housing prices, and to a lesser extent recent increases in mortgage rates, have largely offset the decrease in the average interest rates on mortgages as homeowners refinanced their homes at lower rates during the years after the great financial crisis.
There was a considerable increase in household savings from the stimulus packages. Cumulative excess savings remains high: the recent fall in the savings rate is much too small to have made a significant dent in the excess savings accumulated during the pandemic.
Furthermore, cumulative excess savings is understated. People shifted their consumption during the pandemic toward buying goods (and especially imported consumption goods) rather than consuming services. This may be in part due to consumers anticipating that prices will rise faster than the interest rate on their savings and rationally choosing to deplete their savings (and/or defer spending on services) in order to purchase items today that they intend to consume in the future.13 While they are classified as consumption, expenditures on goods can be a form of savings. These purchases need not be durables. They could be staples with long shelf life such as pet food or groceries or semi-durables such as clothing. Purchases of more energy efficient appliances or motor vehicles with lower maintenance costs can increase future discretionary spending, and thus can be considered a form of savings in which the reduction of the cost of usage is the return on savings.14 These increased holdings of durables and semi-durables all generate use value over many years.15
To see this, consider a person choosing between leasing a Toyota (and paying for the lease through the interest and dividends on their savings) or buying the Toyota by depleting her savings.16 If she buys the car, her reported savings are reduced as is her income from savings, but, aside from tax effects or the differences in costs of leasing versus owning a vehicle, there has been no real change in her economic conditions: her consumption is unchanged as is her discretionary income.17 There are similar biases in the data for measures of savings rates when vacation homes or RVs are purchased, or more generally, for any purchases that deplete savings or increase debt but that generate use value and thus make more disposable income available to be spent in other ways.18
In the first seven months of 2022, spending on imported consumer goods (other than motor vehicles and parts, which are reported separately since they are a mix of consumer goods and purchases by businesses) increased by $75 billion—an 18% increase over the same period in 2021 (this is not seasonally adjusted). Spending on automotive vehicles and parts increased by $19.6 billion, almost a 10% increase.19 These increases are due to a combination of a stronger dollar that made imports cheaper, and greater demand for goods versus services during the pandemic.
Much of the income from purchases of goods accrues to foreign producers. They are unlikely to spend much of that income on increased purchases of U.S. goods and services. Consequently, increased spending on imported goods has served as a release valve for inflationary pressures: to some extent the U.S. has been exporting inflation through the effect of the stimulus packages on spending on imported goods.20 Furthermore, to the extent that purchases of domestically produced goods displaced purchases of services and caused the increase in the profits of domestic firms, purchases of goods versus services has had a dampening effect on aggregate demand.
High demand for goods has led to increased savings by those firms as well as share repurchases and increased dividends. Those cash outflows accrued to shareholders and owners of private firms. Shareholders of firms are largely institutions or high net worth individuals who have relatively low marginal propensities to consume. In contrast, when people hire a personal trainer for example, the money they spend is directly reflected in the income of the trainer. This income is much more likely to be spent on domestic goods and services than when people buy clothes or electronics or other goods in which case some of the income accrues to the profits of the firm which may be saved or paid out in dividends or in the form of share buybacks, while in other cases the recipients are foreign workers and shareholders.
Even for domestically produced goods, much of the value added comes from imported inputs. It is difficult to think of any domestically produced consumer goods that do not embody imported inputs, which are not included in the data on imported consumption goods. To the extent that production of goods is less labor intensive than production of services, purchases of even wholly domestically produced goods are likely to have a smaller stimulus effect than purchases of services. Thus spending accrues largely to people who will turn over that money through domestic purchases—hence the multiplier effect.
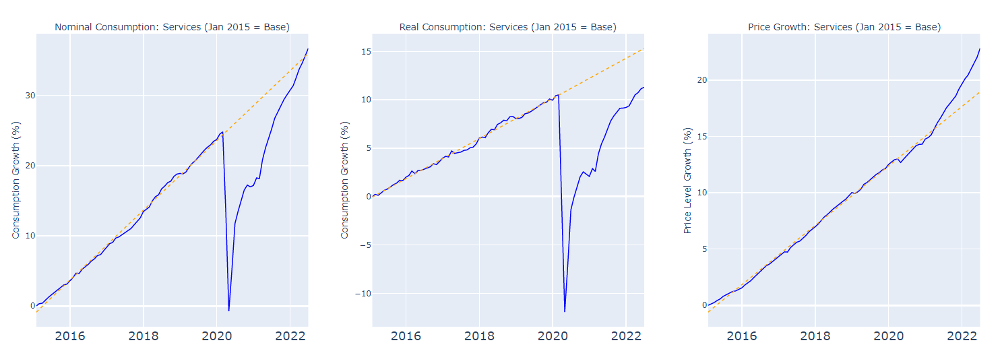
If demand for consumption goods gets saturated and people switch to buying domestically produced services, there could be increased pressure on prices: spending on services will be recycled in the domestic economy through further spending. The increase in demand for services could be disproportionately large due to the accumulation of durable and semi-durable goods during the pandemic.
Corporate Balance Sheets
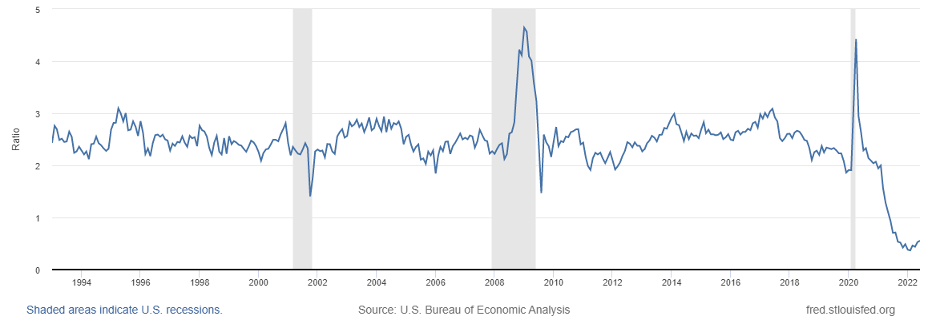
One way a recession is precipitated is when firms feel under pressure to retrench and conserve cash. This is more likely to happen if their interest payments are a large fraction of EBIT (earnings before interest and taxes) which is a reflection of their ability to meet interest obligations during a business downturn. This ratio is very low by historical standards which would suggest that at current interest rates the economy is quite robust.
Ratio of Interest Payments to EBIT for Nonfinancial Corporations21
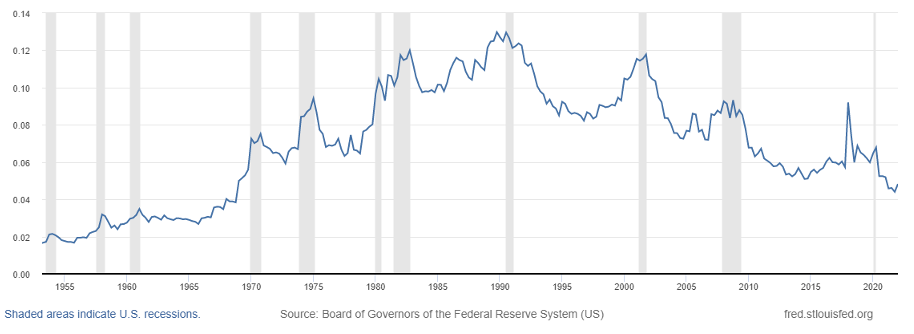
Firms are not very leveraged by historical standards: despite a recent uptick, the ratio remains the lowest in the last 20 years. This suggests that the low interest rate payments to EBIT are not solely a function of low interest rates but are also a function of less leverage. Of course, interest rates are not fixed: the Federal Reserve is increasing interest rates and the rates corporations have to pay on new bonds has increased.
Ratio of Debt Securities and Loans Less Liquid Assets to EBIT for Nonfinancial Corporations22
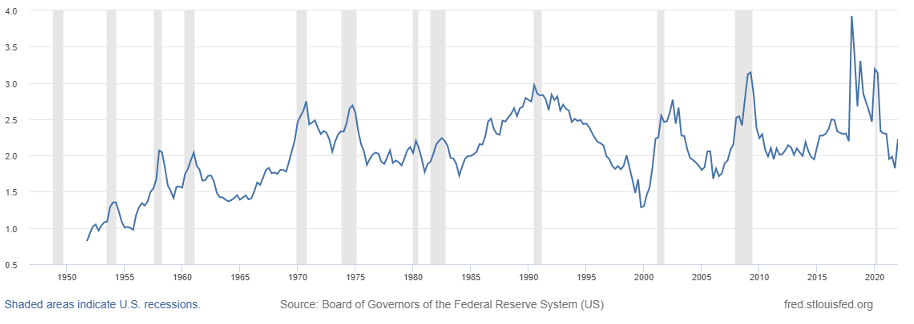
The effect of increases in interest rates on the financial conditions of firms depends critically on the maturity of their bonds, and the amount of bank loans and other floating rate debt.
Roughly 80% of corporate bonds are investment grade,23 and for those companies, average maturity is more than eleven years. The average maturity for the debt of high yield bonds is around six years.24 The relatively long duration of bonds means that the main effect of interest rates on corporate solvency will be through the increases in the interest rates on bank loans and other floating rate debt.
Effects of Interest Rate Increases on Consumer Demand—Why This Time May be Different
Historically, moderate increases in interest rates have their main effects on the demand for motor vehicles and housing. However, tightness in these markets may reduce the effectiveness of monetary policy. The seasonally adjusted level of inventories of motor vehicles to sales is 0.55; this is around 1/5 of historical levels.
Automotive Inventory to Sales Ratio25
Car rental agencies have limited supply and many vehicles are back ordered and often sell for above MSRP. Thus, we would expect that the impact of increases of interest rates on motor vehicles production to be less than in the past.
More generally, the U.S. economy has become much less reliant on the manufacturing sector than it was prior to the last major bout of inflation and the Volker interest rate hikes that squelched inflation. Note that at its peak in 1979, U.S. employment in manufacturing was 19,553,000 or 26.4% of the private labor force; it is currently 12,826,000 or 9.8% of the private labor force.26
Turning to housing, as mentioned previously, there are two measures that are outliers based on historic data: the vacancy rate for houses is very low, and there is a large stock of partially built houses that are likely to be completed. The stock of partially built housing will alleviate the price pressures from the low vacancy rates, but will generate some labor demand to complete those houses and to furnish them. Much of the increase in the cost of housing comes from large increases in the cost of land (including development costs). As higher interest rates depress demand for housing, this may show up in lower land prices which could mitigate the effects of higher interest rates on aggregate demand in the economy.
Investors may be subconsciously influenced by media accounts of softening in the demand for houses. However, due to the way the housing component of the CPI is calculated, increases in mortgage rates could cause inflation as measured by the CPI to increase. The cost of new homes is not included in current measures of the CPI, only imputed owner-occupied rents, which is computed from average rents. Therefore, even if the cost of construction were to fall, but average rents were to increase, the housing component of the CPI would show a price increase.
Historically, rents tend to rise with increases in interest rates and home prices: presumably increases in the monthly cost of home ownership causes renting to become more attractive relative to buying a home and thus leads to higher rents. These effects can have long lags and are sensitive to beliefs about future home prices and the supply of rentals. Average rents tend to change slowly since most rental contracts are long term contracts and landlords tend to increase rents for renewing tenants by less than for new leases. The risk of a recession and the concomitant increase in the risk of falls in home prices may also increase the demand for rental properties.
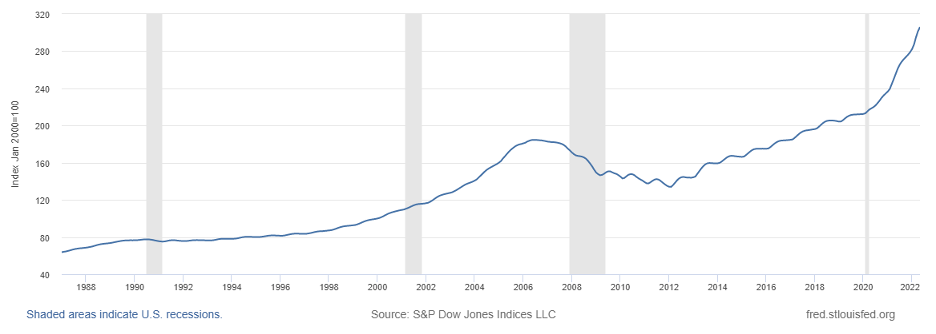
S&P/Case-Shiller U.S. National Home Price Index27
U.S. 30-Year Fixed Rate Mortgage Average28
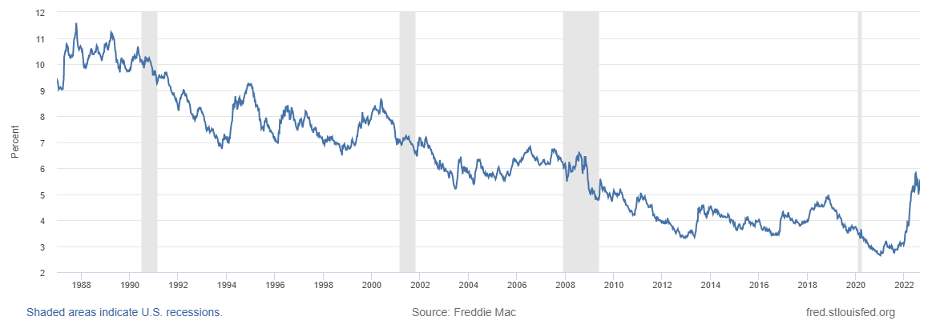
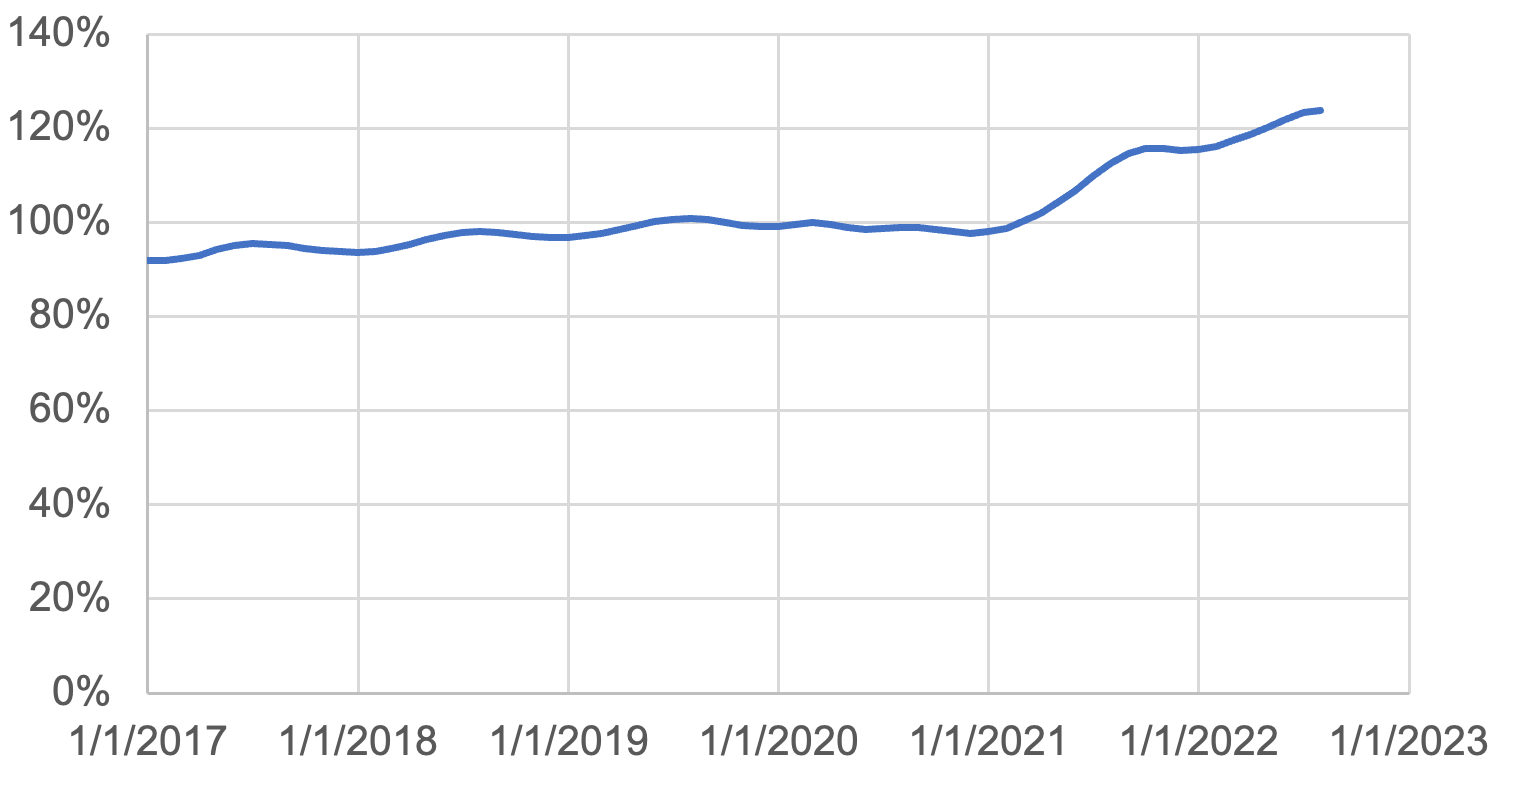
The recent increases in the rent on new leases are dwarfed by the much larger increases in the cost of home ownership due both to much larger increases in mortgage rates and increases in home prices that have also exceeded the change in price of new leases, albeit to a lesser extent (Case-Shiller shows about an 18% increase in prices of the same home over the last year). As leases expire, rents on new leases are likely to continue to increase due to the substantially increased costs of homeownership and rental vacancy rates that remain below pre-pandemic levels. To the extent that increases in real estate prices and interest rates outweigh the increase in rent on new leases, this will also discourage construction of rental properties and exacerbate the housing shortage, putting further pressure on rents.
Median Rent on New Leases, Relative to March 202029
Vacancy Rates: Renters and Homeowners30
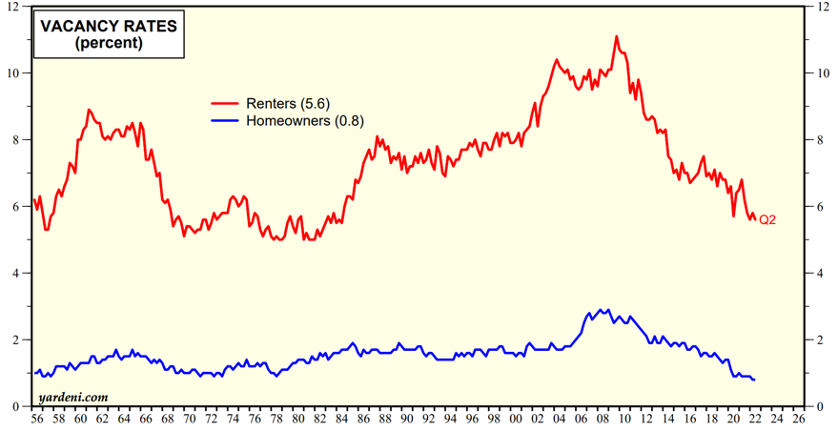
However, even if the cost of new leases were to level off, the effect of new leases charging higher rents than existing leases would continue to put pressure on inflation. The CPI’s high weighting of average rents (31.6%, including both actual and imputed rent for owner-occupied residences) means that this lag can have a meaningful effect on measured CPI. If average rents were to increase by 7.5%, which is our internal estimate of future annual increases in average rents, that would generate 2.4% inflation on top of whatever price increases we might see for other components of the CPI.
In the long run, if higher interest rates cause a decrease in home construction, that will exacerbate the imbalance in the supply and demand for housing and put additional pressure on rents for several years in the future. These effects on home construction could happen sooner if the Fed continues to be aggressive in increasing interest rates, and if the unwinding of its asset portfolio—particularly its holdings of Mortgage Backed Securities “MBSs”—keeps the cost of buying a home high relative to the current cost of renting.
One troubling way in which higher interest rates could cause a contraction in the economy is through adverse effects on businesses with variable interest rate loans. The ratio of loans to EBIT of nonfinancial corporations is troubling.31 It is relatively high by historical standards; it is higher than in the months preceding the great financial crisis.
The low default rates on bank loans could indicate either higher levels of safety (that the banks were lending to better borrowers) or the opposite: that the low default rates were due to low interest rates and easy credit “extend and pretend” that have allowed unprofitable companies to stay in business. When interest rates rise those companies may go bankrupt, or at a minimum, layoff workers and curtail investment—the proverbial “tide going out revealing who is swimming naked.”32
Ratio of Loans to EBIT for Nonfinancial Corporate Business33
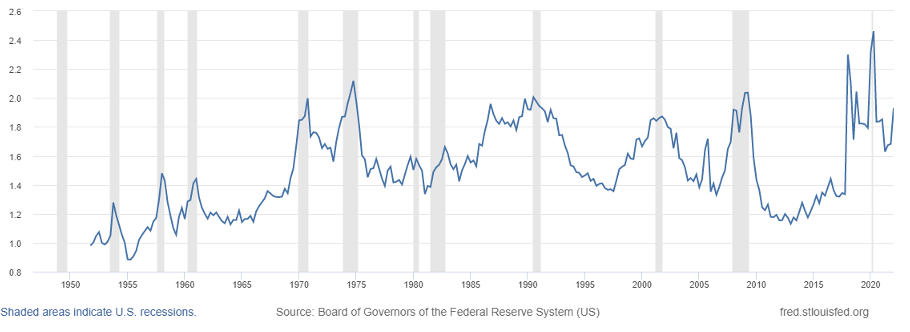
I’m not sure to what extent this is a residual effect of the subsidies for bank loans in the 2020 legislation. Some of those loans have been forgiven (which may explain the more robust financial balance sheets of firms) but others may still be outstanding. The outstanding loans may be a function of fraud—which appears to have been widespread and thus those loans may not be owed by firms with real businesses. However, taken at face value the high ratio of commercial and industrial loans to EBIT could make the economy more vulnerable to higher interest rates.
On the Demand Side—Short Term There May Be Falls in the Prices of Some Goods
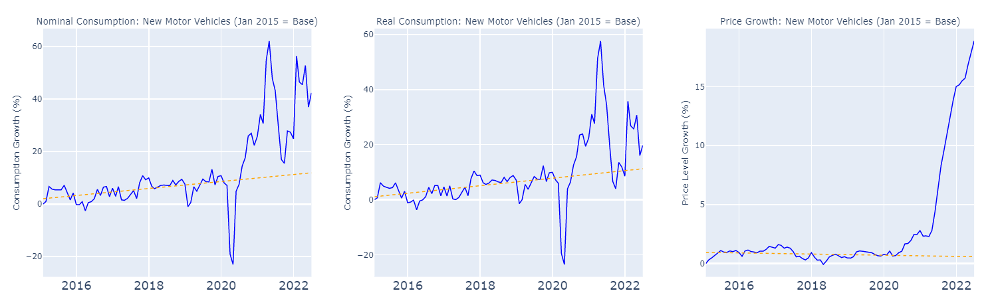
While we are seeing falls in sales of goods, sales of goods are still well above trend. The data for various categories of goods are graphed in the appendix. Note that these trends may understate the cost of inflation. The composition of motor vehicles being sold has changed: the auto manufacturers are producing the more expensive models that have higher mark-ups. This is in part showing up in low purchases of motor vehicles by businesses—that presumably may be more sensitive to being forced to buy options that don’t increase resale value. Spending on the more expensive models that offer options that the consumer would not buy if given the choice is a form of inflation that is not captured in the data. Total spending on motor vehicles (even adjusted for price moves) has increased compared to trend despite the fall in the number of vehicles sold. The average sale price has increased from around $35,000 to over $47,000. To the extent that fewer cars were sold to businesses and inventories are very low, demand for new cars might continue to be high even if interest rates on car loans were to increase substantially. This may also be true for other items that had limited supply and are on back order. Even ignoring the fact that basic cars are often unavailable and so the quality adjustment causes price inflation to be understated, the cumulative increase in prices of motor vehicles has been dramatic. If the prices of new and used cars were to revert to trend, that would cause a significant fall in the CPI.
If futures markets are accurate predictors, we should also expect to see falls in commodity prices—which will either directly affect consumer prices as in the case of gasoline or indirectly affect the prices of goods and services that use the commodity as an input. Of course, the futures market may be wrong and geo-political events could cause commodity prices, and especially energy prices, to soar. However, in the absence of expertise on our part, I would not want to second guess the specialists who are trading the futures in particular commodities.
The futures market is pricing a steady fall in gasoline prices through 2025 (albeit with seasonal variation); futures also predict falls in the prices of diesel and aviation fuel. However, since consumers of gasoline have a higher marginal propensity to consume than do oil producers and refiners, lower prices of gasoline will increase discretionary income. This is likely to increase spending on other goods and services. Since spending on services (and to a lesser extent, spending on other goods) has stronger effects on aggregate demand than does spending on gasoline—since the suppliers of those goods are more likely to spend the income than are the producers of gasoline—the lower price of gasoline could perversely have longer run inflationary effect. I realize that this argument is contrary to the conventional wisdom which is that lower gas prices are disinflationary. I would think of gasoline prices as having a similar effect on aggregate demand as a gasoline tax that is paid as a subsidy to producers. This tax/subsidy would probably not be viewed as having a long run inflationary impact. On the other hand, decreases in the price of diesel fuel, which is more heavily used in construction vehicles and heavy-duty trucks, are likely to be disinflationary as those cost reductions work their way through the supply chain. The effects of aviation fuel price declines on future inflation are also likely to be disinflationary, as are lower costs of other commodities.
Note that historical data of the effect of interest rates on inflation is heavily influenced by years in which domestic manufacturing was a larger fraction of GDP. For consumers of gasoline, a higher price serves as effectively a tax on consumers and subsidy to the producers. It creates comparatively few jobs in oil production relative to spending on services. The main takeaway should be that falls in headline inflation from falls in fuel prices should not be taken as predictive of future disinflation—the opposite could be true.
Embedded Persistence in Inflation from Medical Services
In addition to the lags in changes in the housing market being incorporated into inflation measures (due to using average rents), there are lags in the changes in prices that insurance companies and Medicare and Medicaid pay for medical services. Prices for medical services are negotiated on long-term contracts between payers (largely insurance companies and the federal government) and hospitals, so that prices are slow to respond to changes in the cost of providing services. This is particularly relevant to the PCE, which is a favored inflation measure of the Fed. While the PCE gives much less weight to average rents (only around 16%) than does the CPI, it gives much greater weight to medical services—especially services provided in hospitals.34
Anecdotally, I’ve been told that patients are sicker and staying longer in the hospital for the same procedures—this may be due to postponed treatments due to COVID and to weight gains during the pandemic. Also, outpatient facilities often have no capacity, which requires the hospitals to keep patients longer, all of which increases costs.
The government is unlikely to enforce prices that force hospitals into bankruptcy, and unless the insurance companies raise payments to cover the cost of providing medical services, hospitals and physicians will refuse to accept their insurance for elective procedures. Even prior to the pandemic, the compensation rates were such that some physicians and psychologists refused to accept Medicaid or Medicare and some even refused to accept patients covered by insurers who had low payment rates. Being excluded by the most skilled providers would seem likely to cost the insurers customers among firms. For publicly traded firms and state and local governments, the people who choose the insurers are themselves benefitting from the insurance, but the costs are paid by shareholders or taxpayers. Furthermore, limited availability of Medicare providers could cause political problems for government officials: the elderly are a particularly vocal and powerful interest group.
Conclusion
I think that the media and pundits are overestimating the likelihood of a recession. The economy is more robust than it was prior to other recessions. The models being used are only gradually incorporating data on job openings and quits. Data on job openings and quits were not available before 2000, thus they were not included as explanatory variables in the macro-economic models taught in graduate school, and it is taking time for them to be incorporated into the models. The high levels of job openings would appear to present an economy with much more resilience to falls in demand than is forecast by models that omit those data.
Regarding inflation, quits and job openings are perhaps the two best predictors of future changes in labor costs. Their omission in the standard models may have led to underestimates of inflation. Anecdotally we are seeing more reference to job openings (but not to quits) in the media which may reflect their inclusion in the forecasts of inflation—this could explain why forecasts of inflation have increased sharply in August.
Because increases in interest rates have their main effects on demand for housing and motor vehicles, and since the motor vehicle sector is a much smaller share of the economy than in the past, the fall in demand would have to large enough to overcome the extraordinarily low levels of vacant housing and motor vehicles. The government deficit is projected to be around 6% which will provide additional fiscal stimulus.
The main sources of concern are the poor sentiment readings (which have improved but are still lower than would be expected from the economic fundamentals). Fear of recession could cause a recession. Another risk factor is the fall in real wages which will eventually cause savings to be depleted and lead to falls in aggregate demand.
Sincerely,
Andrew Weiss | CEO, Weiss Asset Management
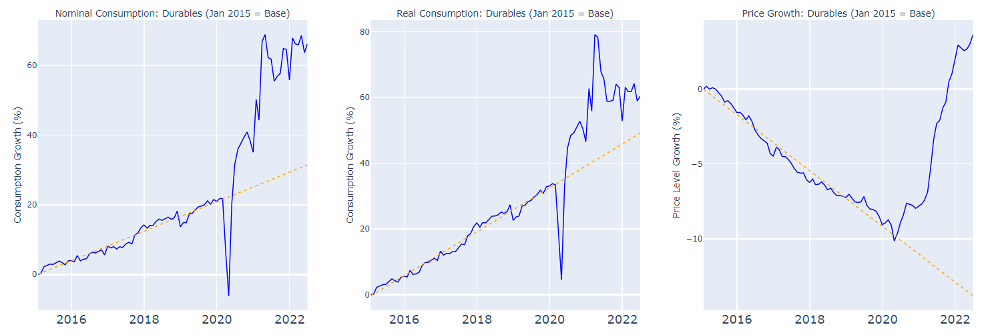
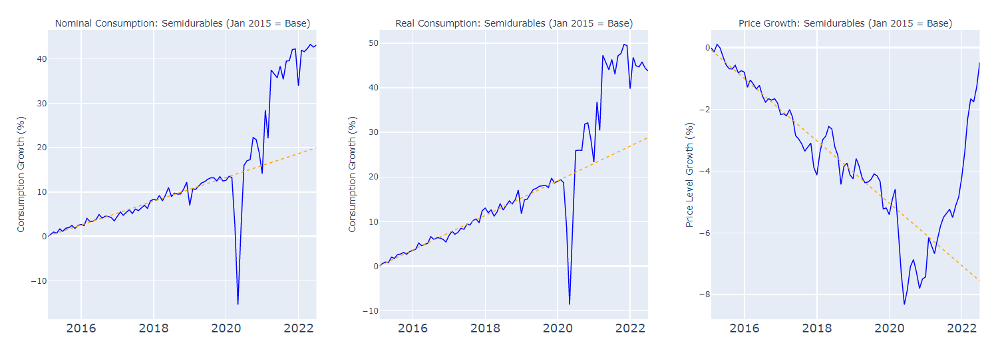
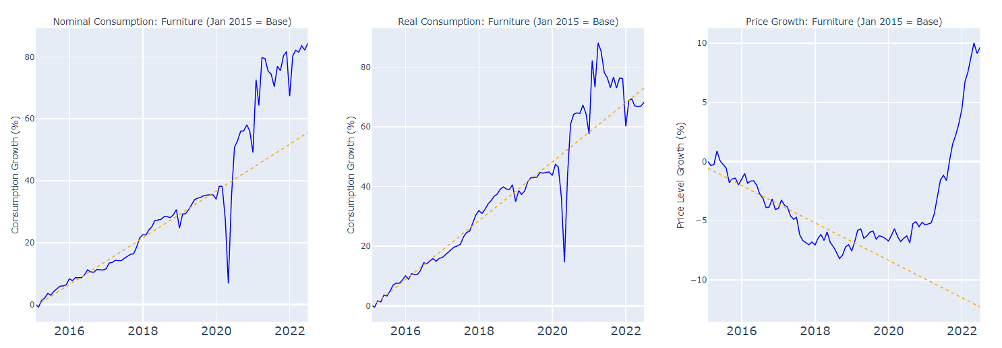
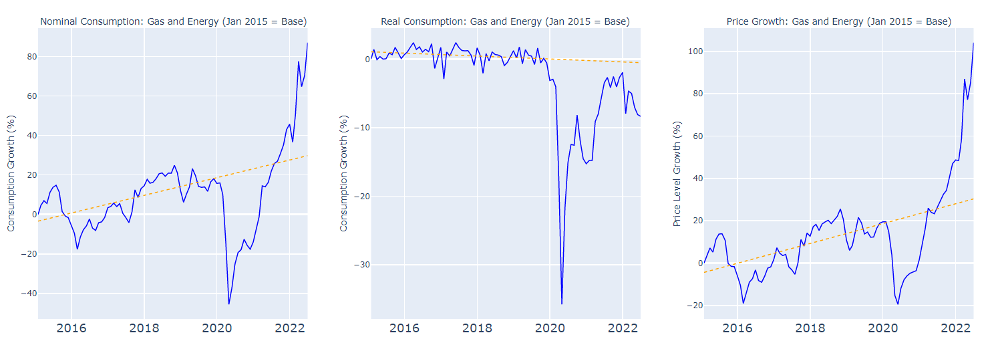
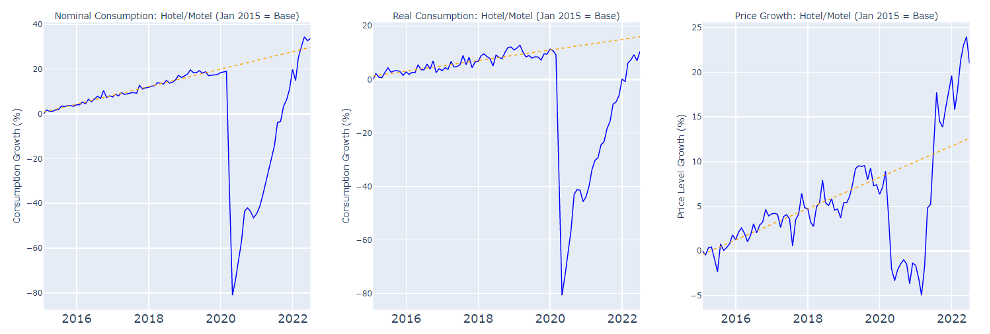
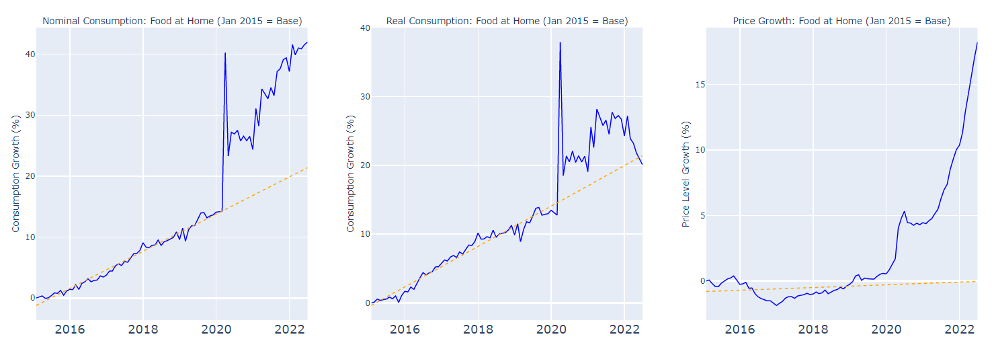
Appendix
Selected Personal Consumption Expenditure Components: Changes in Real and Nominal Spending and Price Levels vs. Pre-2020 Trend Line
Disclaimers:
This commentary has been prepared by Dr. Andrew Weiss and reflects the opinions of Dr. Weiss. This is not an offer to sell, nor a solicitation of an offer to buy any security of any fund (a “Fund”) managed by Weiss Asset Management LP or its affiliates (“WAM”) or any other investment product or strategy. Offers to sell or solicitations to invest in a Fund are made only by means of a confidential offering memorandum and in accordance with applicable securities laws. An investment in a Fund involves a high degree of risk and is suitable only for sophisticated investors that are qualified to invest therein. Commodity trading involves a substantial risk of loss.
This commentary may not be reproduced or further distributed without the written permission of Dr. Weiss. This material has been prepared from original sources and data believed to be reliable. However, no representations are made as to the accuracy or completeness thereof.
Although not generally stated throughout, this commentary reflects the opinion of Dr. Weiss, which opinion is subject to change and neither Dr. Weiss nor WAM shall have any obligation to inform you of any such changes.
This commentary includes forward-looking statements, including projections of future economic conditions. Neither Dr. Weiss nor WAM makes any representation, warranty, guaranty or other assurance whatsoever that any of such forward-looking statements will prove to be accurate. There is a substantial likelihood that at least some, if not all, of the forward-looking statements included in this commentary will prove to be inaccurate, possibly to a significant degree.