Macro-economic Commentary: Recession is Unlikely, Inflation isn’t Vanquished

Inflation is due to demand exceeding supply at current prices as well as increases in the cost of supplying goods and services. The supply of services is determined in large part by changes in labor productivity, the supply of labor and the efficiency of the allocation of resources. The cost of services is determined largely by wages. There are also different multiplier effects from consumption of different goods. For instance, consumption of domestically produced services puts spending power into the hands of U.S. workers and to a lesser extent U.S. firms. Consumption of imported goods puts spending power into the hands of foreign workers and foreign firms. U.S. workers and firms are more likely to spend their income on U.S. produced goods and services than are foreign workers. On the cost side, wages are the main determinant of the cost of services. Increased labor demand and decreased labor participation rates push up wages and thus the cost of providing services, which is then reflected in the prices of services. Changes in the composition of the labor force can also affect labor productivity. If less productive workers are being hired, then reported changes in average wages will understate the increased cost of providing services.1 The cost of providing goods and services is also affected by changes in total factor productivity: the productivity of both labor and capital. Total factor productivity (both with and without adjustments for utilization) as measured by the San Francisco Fed has declined in the last three quarters. This is likely due to changes in the composition of the labor force.

To get to the punchline, I think most of the commentary I’ve read overestimates the risk of recession in the near term. I think the risk of recession is low and the disinflationary effects of falls in commodity prices and a strong dollar will dissipate over the course of the next year. Thus the risk of continued inflation is high. If I’m correct, interest rates will be higher for longer than markets are predicting.

Labor Market Demand

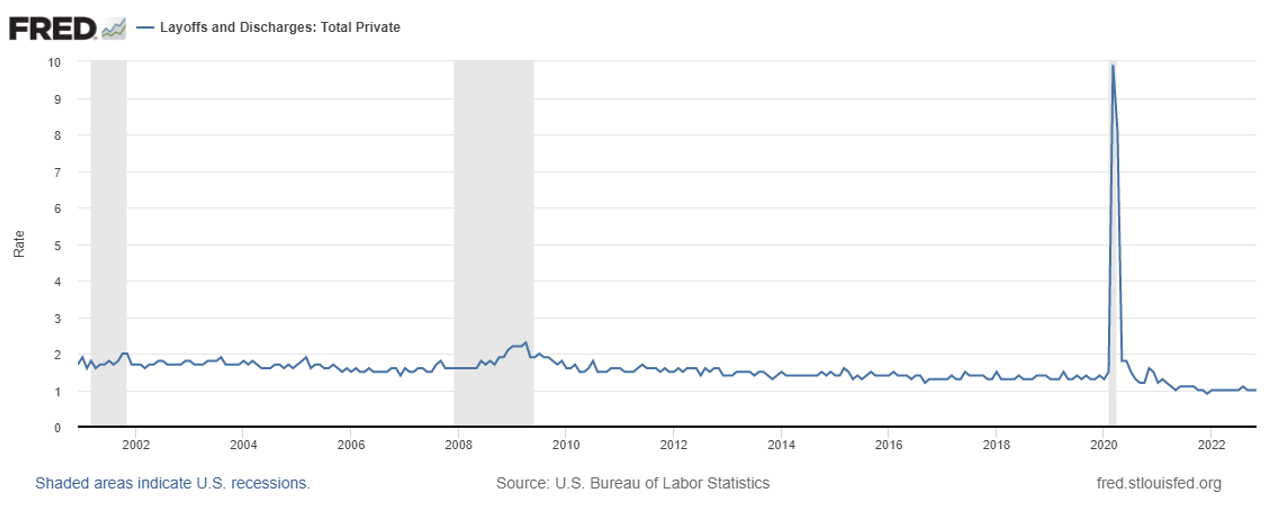
Job openings and quits as a fraction of employment are at historically high levels. The rate of layoffs plus dismissals continues to be at an historically low level. The media is focused on layoffs of some prominent firms (those make good human interest stories), but the overall rate of layoffs and dismissals is at an historical low. Cumulative net hiring during 2022 was 4.5 million workers—a large fraction of the labor force.2

Layoffs and Discharges as a fraction of total private employment3
Hiring is strong: in December, firms added 223,000 workers.4 Hiring was strong across almost all sectors. (Surprisingly construction was one of the sectors with net increases in employment; this may be due to the lagged effects of the infrastructure bill as well as onshoring initiatives.) The media accounts of the net additions having decreased are misleading. Clearly as the pool of potential workers (unemployed and discouraged workers) shrinks it becomes more difficult to gain new workers. At the extreme, new hires must converge toward zero.

Job openings as a percentage of employment were 6.4%, compared to a pre-pandemic peak of 4.7% in 2019.5 If we focus on the private sector the labor market is similarly strong, with job openings at 6.8% of total employment—well above their pre-pandemic peak of 5.1%—and layoffs plus dismissals well below pre-pandemic levels.6 Private sector layoffs and dismissals are 1.0% of total employment compared with 1.5% in February 2020.

All these indicators suggest that labor demand is very strong. We may expect some weakening in labor demand due to higher wages and changes in the composition of the labor force. Small businesses report that labor quality is their top operating problem (cited by 21% of small businesses).7 The San Francisco Fed has reported three consecutive quarterly declines in labor productivity. This is likely due to a combination of changes in the composition of the labor force and low productivity of newly hired workers as they learn their jobs and as other workers are reallocated to train the new hires. Despite the decline in labor productivity, firms are still reporting that they plan to increase employment.

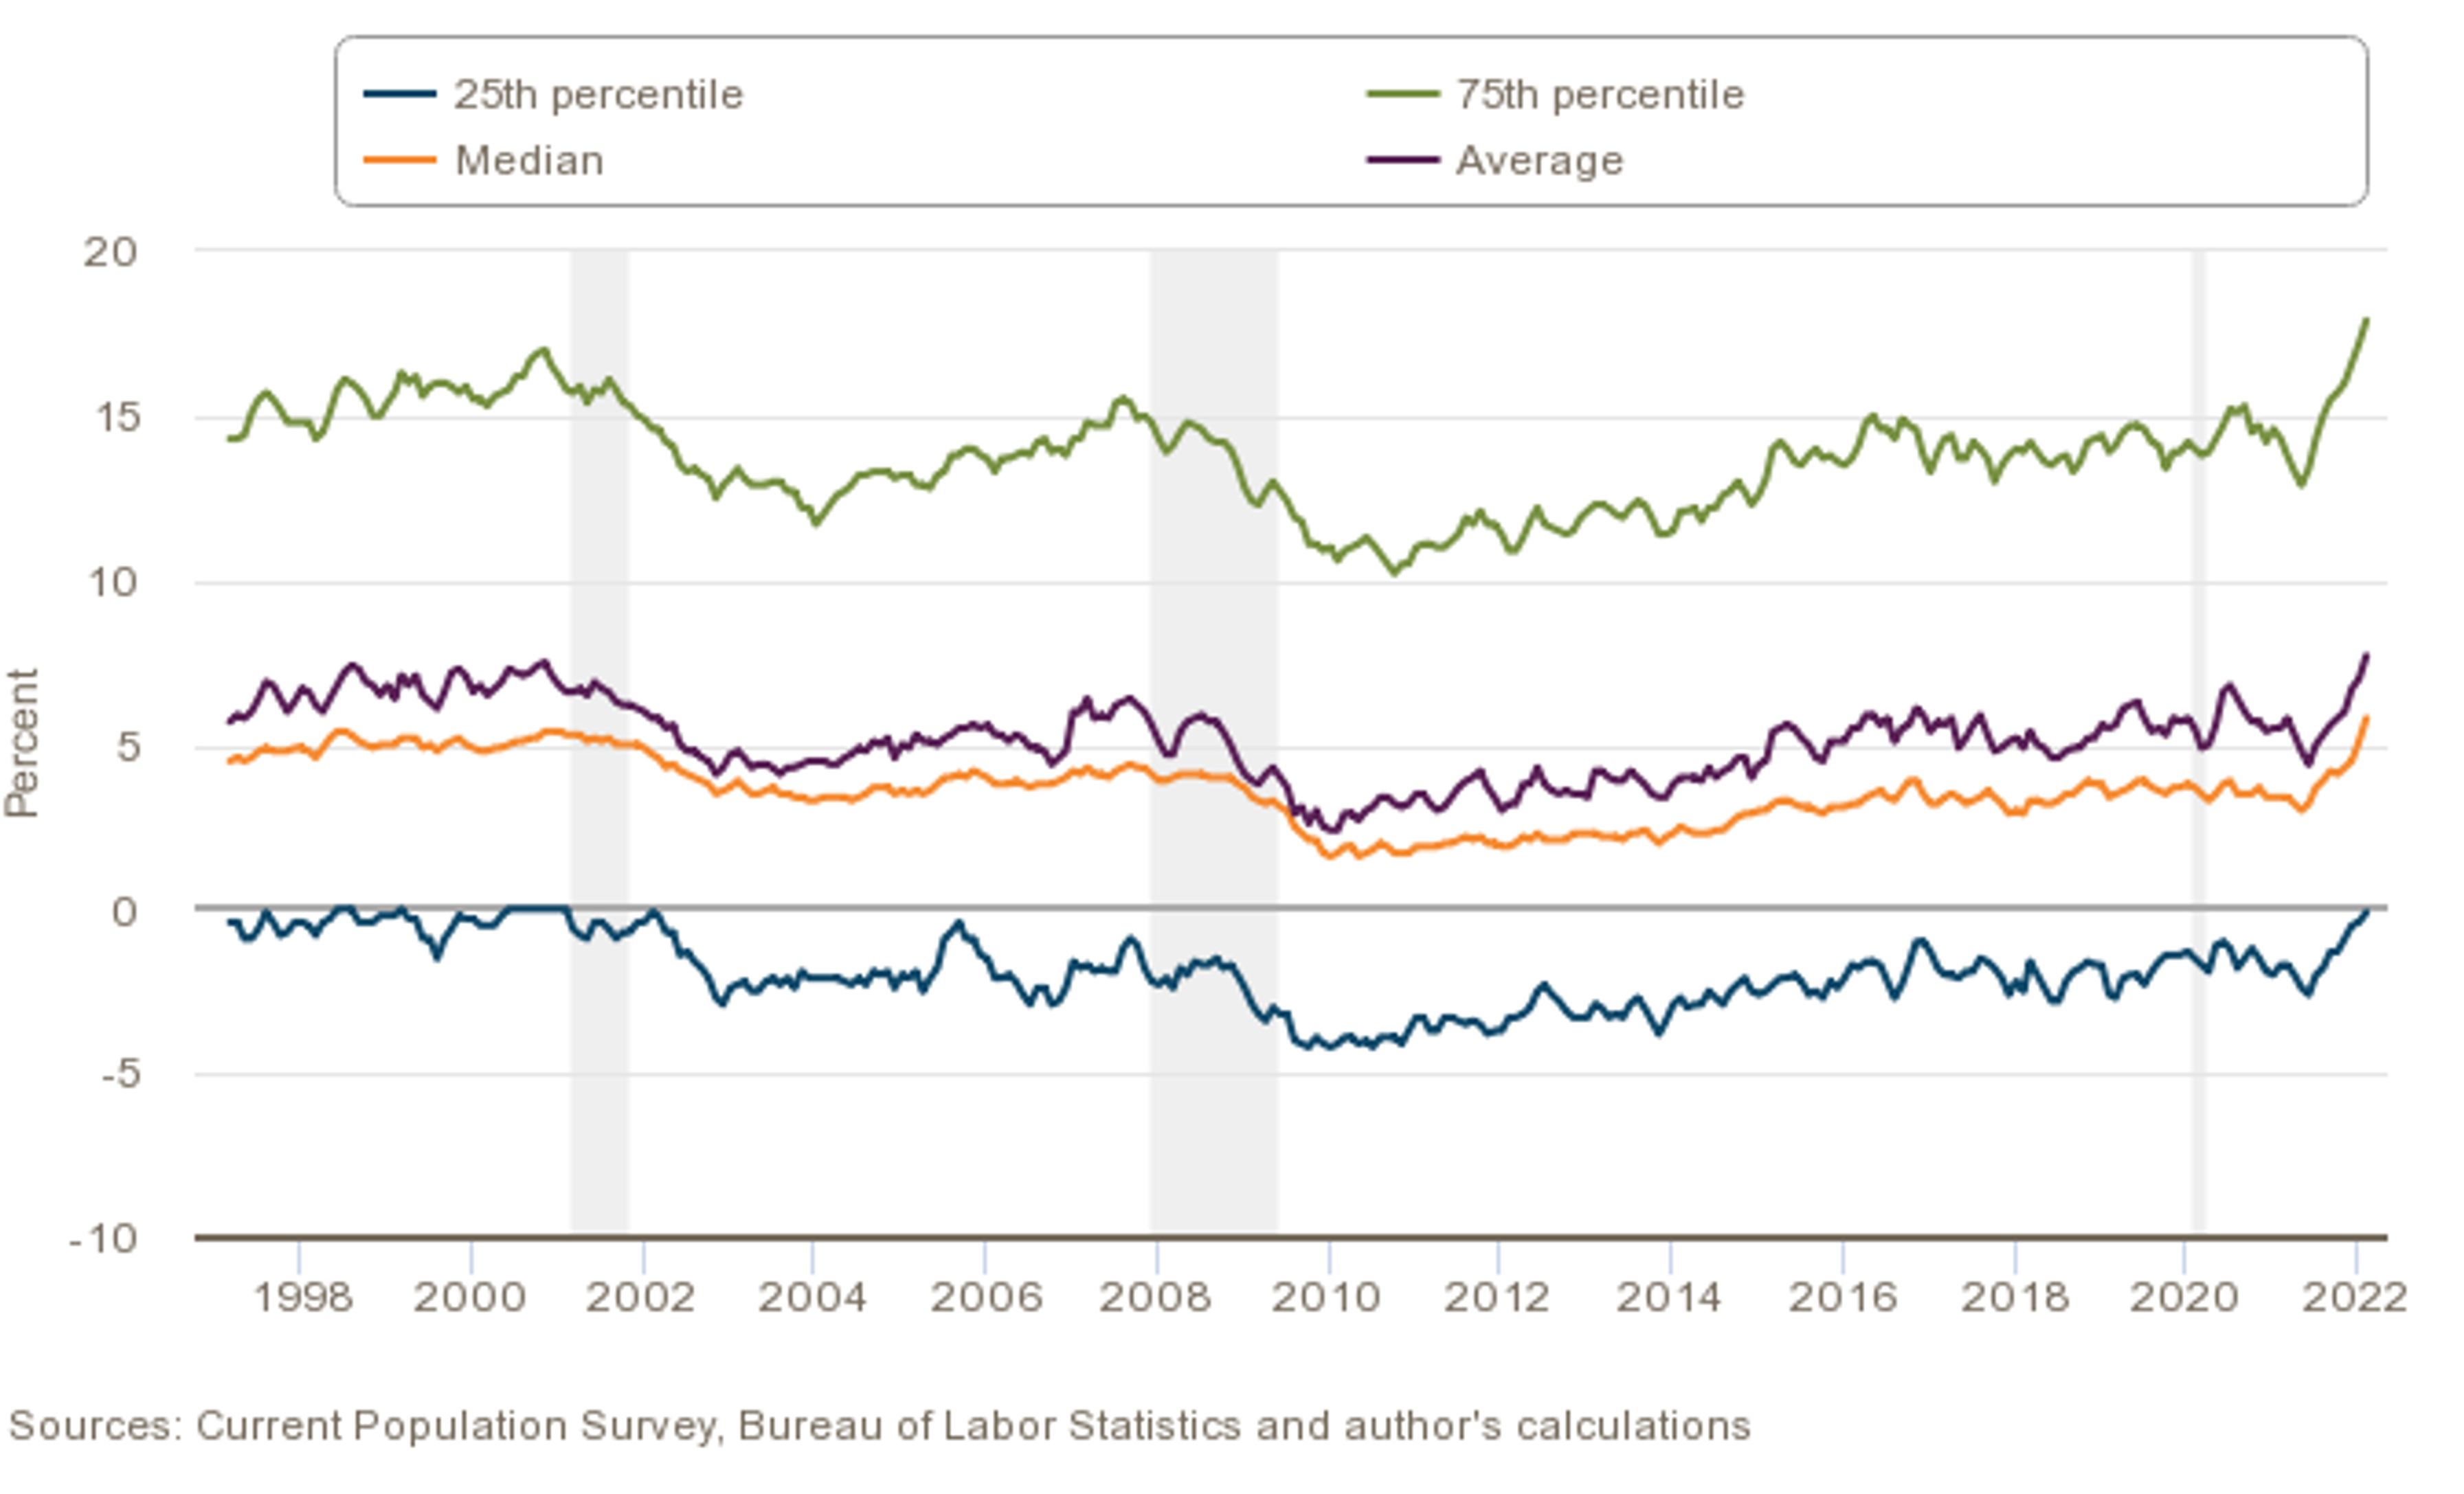
To the extent that the high level of quits is due to falls in real wages and the use of signing bonuses to help fill job openings, we expect continued upward pressure on wages, after adjustments for changes in labor force composition.8 Wages growing faster than productivity will put pressure on the prices of services, other than rents. We are also seeing an increase in the demand for services. The increase in the share of employment in low wage industries such as leisure and hospitality will tend to depress reported average wages and thus give a misleading signal about wage inflation. A better measure of wage inflation is the wage data reported by the Atlanta Fed, which looks at wage changes for the same people and thus removes effects due to changes in the composition of the labor force. The Atlanta Fed is reporting median wage growth of 6.4%.9

Looking forward to the effects of higher interest rates on labor demand, the sectors that are most sensitive to interest rates are production of motor vehicles, residential construction and, to a lesser extent, production of other durable goods. Employment in manufacturing of motor vehicles and parts is less than seven-tenths of 1% of total employment.10 Employment in residential construction is less than six-tenths of 1% of total employment. Combined employment in residential construction plus motor vehicle and parts manufacturing is around 1.3% of total employment. This seems small in an economy with job openings greater than 6% of total employment. Durable goods manufacturing is roughly 5% of total non-farm employment. By comparison, in 1979 durable goods manufacturing was 13% of total employment. Thus, it seems unlikely that the contemplated increases in interest rates will be sufficient on their own to offset the strength of the labor market, bring down wages and dramatically increase unemployment.11

Labor Market Supply

If we consider the potential supply of workers, the most relevant measure is probably U-6, which is the percentage of the unemployed plus marginally attached workers plus workers who are working part time for economic reasons (can’t get a full-time job). In November U-6 was at an historical low relative to pre-pandemic levels (using data going back to 1994). The low level of U-6 suggests that there is not a sizable pool of currently available workers to fill the job openings. We find similar results using other measures of unemployment such as U-5, which measures discouraged workers (workers who are not looking for work but would like to get a job if one was available) plus unemployed workers currently looking for work, and U-3, which just measures the latter. The unemployment numbers came in at 3.5% for December, tied for an all-time low. Levels of discouraged workers and individuals working part time for economic reasons are also low by historical standards.

The 8.7% increase in Social Security payments starting in January combined with the incidence of long-haul COVID will likely keep labor force participation rates low. The persistence of COVID infections and the large increase in cases of flu and RSV will be reflected in decreases in hours worked as people stay home either because they are ill or need to take care of sick relatives. High job turnover can also impair growth in labor productivity.12 The decrease in effective labor supply (measured in terms of productivity) holding labor demand constant would be inflationary. Since demand appears to be increasing, the inflationary effects are stronger.

The prime age labor force participation rate (ages 25-54) at 82.4% is higher than it was between 2010 and 2019.13 The overall labor force participation rate at 62.3% is below its pre-pandemic levels and about where it was in 2016. This low participation rate is thus likely to be due to the aging of the labor force and the effects of COVID on labor force participation of older workers. Older workers do not appear to be being drawn out of retirement by the strong labor market. They can draw on increases in housing prices and Social Security benefits to finance retirement and may have changed their preferences in response to the risk of contracting COVID or to the effects of long-haul COVID.

Various measures of unemployment, including measures that include discouraged workers and workers that are employed part time for economic reasons, also indicate fairly low potential supply of workers. The increase in mortgage interest rates could further hinder discouraged workers from being available to employers in areas outside of commuting distance of the residence of the discouraged worker. While there is an increased amount of remote work, this is likely to be a small effect over the long run: in many cases work that can be done remotely in the U.S. can also be done more cheaply in low wage countries outside the U.S.

The takeaway is that I don’t think there is much potential for an immediate increase in the number of workers available to fill the large number of job openings.

In the short to medium term, the COVID pandemic seems likely to decrease labor supply both by increasing absenteeism and reducing labor force participation rates through the indirect effects of long COVID. An aging population in the developed world will divert workers toward caring for the elderly and away from supplying the goods and services measured in the Consumer Price Index (“CPI”).14

Turning to the likely path of long run labor productivity: the 2017 tax law calls for expenditures on research and development and on software development to be amortized over five years if pursued domestically and over 15 years for foreign spending. The tax law provided special benefits for real estate developers—especially those that utilized pass-through entities such as LLCs and limited partnerships. Diverting resources from research and development in order to free up funding to support the real estate industry is damaging to long run productivity and will contribute to inflation. Subsidies to the real estate industry distort the allocation of capital in ways that damage productivity. There are fewer if any positive externalities from construction of homes or other buildings, so diverting investment funds and skilled labor into the real estate industry implies less productivity-enhancing investment in industries with positive spillover effects on long run productivity.

The Penn Wharton Budget Model projects that skill-adjusted productivity will grow at an annual rate of 0.89% in 2020-2029 and will average 0.68% annual growth from 2020 through 2049.15 This is less than half the annual growth rate from 1980 to the present, and somewhat lower than the productivity growth rate of 1.06% from 2010-2019.

Balance Sheets

According to a recent Fed paper, households held about $1.7 trillion in excess savings as of mid 2022.16 Savings is defined as the difference between income net of taxes and consumption, and excess savings as the cumulative deviation from trend starting at the beginning of the pandemic.17 Most of the excess savings was held by the top half of the income distribution (roughly $1.35 trillion of the $1.7 trillion total excess savings). These individuals are experiencing relatively small increases in wages, but they can use their excess savings to support their consumption.

Aside from measured increases in savings, there have been very large increases in home values that can be drawn upon through home equity lines of credit (“HELOCs”), home equity loans or reverse mortgages. As opposed to stocks and bonds, home ownership is widely held and is the main source of personal assets. On the other hand, the same high interest rates that could cause a recession may deter people from borrowing against the value of their homes. However, the net effect of increased home equity is likely to provide a buffer against falls in demand.

On the business side, large U.S. firms account for a significant share of private sector employment and get most of their external financing through bonds. In aggregate, large firms have large cash balances, due in large part to the increase in earnings as a fraction of GDP.

On the other hand, a greater percentage of the liabilities of small- and medium-sized firms and foreign firms are floating rate bank loans and thus such firms are much more vulnerable to increases in interest rates. Large increases in interest rates may induce bankruptcies of small- and medium-sized firms, especially those that have only survived because of the availability of cheap credit. Overall, however, balance sheets seem strong; thus if we combine the cash positions of firms with their low-interest debt, large firms in the U.S. business sector seem insulated from the adverse effects of moderate increases in interest rates. The macroeconomic risk from higher interest rates lies in the risk of bankruptcies of small- and mid-sized firms. During the years since the global financial crisis default rates in the U.S. have been very low. That may be due to the low interest rates. In that case we may find default rates will exceed historical levels if interest rates stay at high levels.

Automatic Stabilizers

While I believe that the strength of the labor market and strong balance sheets have reduced the likelihood of a recession, recent changes in the tax code have reduced the effectiveness of automatic stabilizers: sources of revenue and expenditures that automatically dampen both booms and slumps by curtailing demand during booms and sustaining spending during slumps. Thus, if a recession were to occur it will be more severe than if the automatic stabilizers had been retained. The gradual eroding of automatic stabilizers due to recent changes in the tax code has perhaps received insufficient attention as a contributing factor to the severity of the Great Recession.

Note that while I’m illustrating the destabilizing effects of various programs, I’m not making a statement about the welfare implications. That depends on how one values the other benefits and costs of the programs.

The 2017 tax bill seriously impaired the effectiveness of automatic stabilizers in the tax code, thus increasing the risk of serious recession. On the other hand, the expansion of Medicaid benefits and the increased spending on Medicare and Social Security provide a measure of spending that is independent of other economic conditions.

Corporate profits are highly pro-cyclical. The 2017 changes to corporate tax law eliminated back averaging, which transfers funds to corporations that are incurring losses during a recession. These changes also increased forward averaging. Back averaging gives money to firms that are suffering losses after previously earning profits; this is more likely to occur during recessions. Forward averaging gives money to firms that had previously incurred losses; this is most likely to occur during a boom that follows a recession. Thus, back averaging smooths the business cycle and forward averaging exacerbates it. These two measures, combined with the cut in corporate tax rates, increase the magnitude of the pro-cyclicality of after-tax corporate profits and thus increase the volatility of the business cycle. Other revisions disallowed deductibility of interest payments above 30% of EBIT (earnings before net interest expense and taxes).18 Firms that incurred losses can owe taxes. This is most likely to happen during a recession that is accompanied by high interest rates: the recession would depress operating profits, which reduces the tax deductibility of high interest rates, and the combined effects of lower operating profits and higher interest rates could cause the firm to incur losses while still owing taxes. Because tax obligations have priority in bankruptcy over other debts incurred prior to bankruptcy, those firms may have particular difficulty getting financing to avoid bankruptcy. Thus far we haven’t seen this provision of the tax code leading to less use of debt financing over equity financing. Holding leverage fixed, it is an automatic destabilizer.

Entitlement programs are somewhat counter-cyclical and can support the economy during a downturn. More people qualify for Medicaid and other means-tested programs during a slump. Spending on Medicare and Social Security and other government funded retirement programs does not fall during recessions and thus helps sustain aggregate demand.

The long-term effects of underfunded entitlement programs and cuts in revenue from indexing tax brackets and cutting tax rates are problematic, but it is difficult to know when the impact of the resulting cumulative deficits will impact the economy.

Fiscal Policy: Spending Increases

While U.S. deficits will shrink from the extraordinarily high levels during the COVID pandemic, they will continue to be very high. Due to the 8.7% increase in CPI-W inflation from September 2021 to September 2022, Social Security, disability payments and SNAP benefits will increase by 8.7% starting in January. Income tax brackets will also be adjusted by 8.7%.

The 2022 appropriations bill will increase defense spending by roughly 10%. It is unclear when the increased appropriations for weapons will be spent, but the increases in salaries will have an immediate impact on demand. Increased employment in the defense industry will decrease labor supply in other sectors that contribute to the components of the CPI and thus will be inflationary. Increased demand for capital equipment will similarly decrease the capital available in other sectors, suppressing supply and thus increasing prices. There are some differences of opinion on the magnitude of the increase in non-defense spending in the budget bill, but it seems roughly in line with inflation and perhaps to be a decreasing share of GDP. The Medicare and Social Security deficits will almost surely increase, as will interest on the national debt.

Balance of Trade and Exchange Rate

The appreciation of the dollar against other currencies has led to a large cumulative increase in imports of foreign goods. Imports of goods increased by roughly 42% from 2020 to 2022.19 Thus we have exported much of the inflationary effects of the stimulus package. A large percentage of U.S. purchases of motor vehicles and parts and other goods is imported. The prices of those goods have recently been falling, due in part to the appreciation of the dollar—a strong dollar means that the cost in dollars of producing abroad falls, which enables foreign producers to sell at lower prices. This fall in the price of imports is a one-time shot and is not likely to continue.

Housing

Housing merits special attention. Shelter is roughly 1/3 of the CPI, and peculiarities in how the cost of shelter is calculated affect reported levels of inflation. These peculiarities affect the CPI and to a lesser extent PCE Price Index but do not affect the likelihood of recession, except insofar as the reported inflation numbers affect cost-of-living adjustments, sentiment and policy decisions. Therefore, I’ve relegated the treatment of housing to an appendix.

Sentiment

The biggest risk to the U.S. economy is negative sentiment. If decision makers interpret a negative yield curve as a precursor of a recession, then they will retrench and a recession will occur. This is a psychological phenomenon but it is nevertheless very real. Falls in spending and falls in investment generated by a fear of a recession will cause a recession.

Although surveys show high levels of pessimism, behavior is different. Firms continue to hire at high rates. As mentioned previously, in December the private sector added 223,000 jobs, around twice pre-pandemic levels. The media writes stories about the tech firms that are laying off workers; it doesn’t write stories about the firms retaining workers that under other circumstances would have lost their jobs, or about the many firms that are adding workers. Good news doesn’t sell.

While spending on consumption goods has fallen, this may be largely due to falls in prices of imports and the switch from spending on goods to spending on services. The GDPNow data from the Atlanta Fed is forecasting a 4.1% increase in real GDP in the fourth quarter of 2022.20 Again, these data are inconsistent with retrenchment by firms or consumers as would be happening if they believed a recession was imminent.

Efficacy of Federal Reserve Policy

The last time the Fed had to intervene to combat high inflation was in the late 1970s and early 1980s, causing the federal funds rate to peak at 19% in 1981.21 The methodology used to calculate the cost of owner-occupied housing changed in 1983. If we used the pre-1983 methodology today or computed inflation in the early 1980s using the current methodology, we would find inflation is currently closer to the levels of the 1980s than would be apparent from the reported numbers. Prior to 1983 there were restrictions on the interest rates that banks could charge on checking accounts and time deposits. Thus the high interest rates paid on treasury securities caused a massive flight of deposits out of the banking system. This effect is no longer present: banks can respond with higher interest rates on deposits to avoid capital flight. Also, the banks have large cash balances and can use their holdings of government securities to access cash from the Federal Reserve. Because of the long maturity of firm bond debt and strong balance sheets, large firms are less affected by higher interest rates than at most times in the past.

In the short to medium term, higher interest rates have the most immediate effect on demand for motor vehicles and housing. Inventories are low and employment in those industries is not a very significant fraction of total employment. High interest rates also depress investment by firms, but there are strong tax incentives to invest in new plants and equipment, as well as trade tensions that are encouraging firms to engage in more onshoring. The increase in defense and infrastructure spending also will be stimulating private investment.

The main tool that the Federal Reserve has to cause disinflation is forward guidance: these communications affect mass psychology and thus behavior. If the Fed communicates its intention to fight inflation, and decision makers believe that other decision makers will retrench in response to these communications, then the economy will contract and there will be disinflation. Economies have multiple equilibria and communications from the Fed and commentators can affect sentiment in ways that have real effects on the economy.

Concluding Remarks

My forecasts are based on economic fundamentals. I have no expertise in predicting changes in sentiment. In particular, forecasts of recession could cause a recession. So even if the forecasts are based on a misunderstanding of the economic fundamentals, those forecasts could end up being self-fulfilling because they are widely believed. Forecasts of recession could also cause firms to be cautious about wage increases and workers to be reluctant to change jobs and give up seniority which can be valuable in the event of layoffs. Consequently, inflation could be below the rates we’d expect from the economic fundamentals. Because my analysis is solely based on economic fundamentals and ignores these important psychological feedback effects and other factors affecting sentiment, the predictions in this commentary should be taken with due caution.

Based on fundamentals, I think a recession is highly unlikely unless the Federal Reserve decides to raise interest rates to well above the forecasted levels. CPI Inflation is likely to subside in the next few months but then re-emerge. Prices of services respond more slowly to changes in demand than do prices of goods, so as people switch from purchases of goods to purchases of services, and as the fall in commodity prices and the strength of the dollar are reflected in the price of goods (especially imports, gasoline and food), the fall in prices of goods will show up in lower inflation rates in the near term. At the same time, the supply of rental housing that is coming on the market will depress prices of new leases and will depress the imputed rental value of owner-occupied housing as well as of rentals. The decrease in life expectancy of people over 65 that started with the pandemic will decrease spending by retirees and may have a slight disinflationary effect, which could offset the lower employment levels that have accompanied the pandemic. The decline in residential construction, sales of existing homes and sales of new cars will also dampen inflationary pressures.

These disinflationary effects will be countered by the 8.7% increase in Social Security benefits and other inflation-linked entitlements and the changes in tax brackets starting in January. The strong labor market will continue putting pressure on wages. Mandated increases in salaries in the defense department and the lagged effects on spending of the infrastructure bill will also increase aggregate demand. The net effects are likely to cause inflation rates to fall in the near future but for CPI inflation to remain well above the 2% target set by the Federal Reserve. I expect unemployment to remain below the 4.5% level that seems to be the consensus regarding the “natural rate” (non-cyclical rate) of unemployment. (While I’m somewhat dubious about this number being the natural rate, it may be a driving factor for the Fed’s interest rate policy.) Therefore, I think a cut in interest rates is unlikely over the next 12 months.

Starting sometime in late 2023 or 2024, the inflationary effects of government initiatives will be felt more strongly. These inflationary government initiatives include both direct spending and multiplier effects of subsidies for investments, as well as regulatory rules that induce more investment. Mandated spending on long-term infrastructure projects will continue to influence demand for construction work as the projects work their way through the permitting and approval process. Contracts for defense procurement goods will have similar long run effects.

Spending on defense decreases the supply of labor and capital available for the goods and services included in the CPI. By contrast, spending on roads also decreases labor and capital available for other activities, but spending on roads also increases labor productivity—largely by improving the allocation of labor. There is also likely to be increased spending by state and local governments to fill the need for teachers, medical personnel, police officers and other civil servants. Employment by state and local governments will reduce the supply of labor available for sectors supplying the goods and services measured in the CPI and thus could have a long-term inflationary effect. The other factor affecting labor supply is long-haul COVID, and recurrence of new variants of COVID will continue to depress labor supply. Overall, these trends seem likely to lead to persistence of inflation. For the reasons described above I see very little prospect of a recession at current interest rates or even ones marginally higher. Thus I see little prospect of the Federal Reserve goal of 2% inflation being achieved in the next few years. The recent fall in oil prices and natural gas prices and the fall in the stock market will likely cause CPI inflation to moderate over the next few months. But the tailwinds from a tight labor market and government spending will prevent the Fed from getting inflation down to its goal of 2% in the next few months unless it is willing to push interest rates high enough to cause a recession. In particular, I believe that inflation over the next five years will be above the 2.3% rate implied by the market for inflation swaps.

In the very long term, the exponentially growing ratio of debt to GDP is a potential disaster. I doubt this issue will be addressed before the Medicare trust fund runs out of money and probably not until the Social Security trust fund runs out of money, which is currently expected to happen in 2034. If nothing is done before then, there could be an economic crisis if investors lose confidence in the fiscal stability of the U.S. In the words of Herbert Stein, “if something can’t go on forever, it won’t.”

A wild card is the deal that Kevin McCarthy made to become speaker. If he will hold the increase in the debt ceiling hostage to cuts in spending then we are entering uncharted territory. It is possible that a deal will be reached that addresses the foregoing long run fiscal imbalances, or gives the appearance of doing so without effecting fundamental reforms; it is also possible, albeit unlikely, that the U.S. defaults on its debt.

Two caveats to the analysis: low inflation rates in Japan both in absolute terms and more recently relative to other countries, and the relatively low PPI inflation rates. Relatively low inflation in Japan in the face of large fiscal and monetary stimulus, as well as an aging population, are a challenge to standard economic analysis. The PPI inflation rates, which measure the prices that domestic producers of goods and services are charging, are significantly lower than the inflation rates in either the CPI or the PCE. This could be due to low response from firms—the firms which are raising prices the most may be less likely to reply to the survey—as well as the omission of services such as the implicit rent on owner-occupied housing that are not included in the PPI. On the other hand, it is possible that the PPI is capturing features of the economy that are missed by other inflation measures. As always, a measure of humility is always useful in forecasting. As Niels Bohr said, “Prediction is very difficult, especially about the future.”

Appendix
The rental component of the CPI is average rent, and it thus lags behind market conditions which affect the rents on new leases. The rents on new leases have been falling recently, but still are greater than average rents, which we estimate will generate artificial price increases on rents as leases turn over. The other distortion comes from the imputed rent on owner-occupied housing which is roughly 24% of the CPI-U (the measure of CPI reported in the media). Since the owners are implicitly paying this rent to themselves, monthly or annual changes in the imputed rent of owner-occupied housing does not cause significant changes in the cost of living, and thus, while changes in prices of utilities or property taxes affect discretionary income available for other goods and services, changes in the imputed rent on owner-occupied housing do not directly affect spending for other goods and services,22 aside from perhaps the indirect and opposite effect of higher imputed rent increasing the value of housing and thus increasing potential spending by homeowners.23

Another distorting effect comes from the fact that while around 90% of owner-occupied housing is single-family homes, there is relatively little rental of single-family homes. Consequently, the formula for imputing the rent on owner-occupied dwellings places only 33% weight on the data from rents of single-family detached dwellings. While total starts on residential construction are falling, starts on multi-unit dwellings are holding up well and starts on units that are intended to be rented are increasing strongly. As of November, privately owned housing units under construction is up 14.5% from a year ago; this is mainly driven by a 26.2% increase in five or more unit dwellings. Thus, in the short run, I would expect the increase in the supply of rental units to suppress pressure on rents and to perhaps cause a fall in the rents on new leases. On the other hand total starts are down 16.4%, while total starts of multifamily units are up 24.5%.24 Thus in the long run the shortfall in total supply of residential units and the lack of affordability of home ownership due to higher mortgage rates and higher home prices is likely to cause rents on apartments and attached homes to rise, thus leading to price inflation in the shelter components of the CPI.

As a result, the peculiarities of how owner-occupied housing is treated in the CPI seem likely to depress CPI inflation in the short run, but may increase it in the long run as the decrease in the supply of new residential units causes rents to catch up with the cost of home ownership. The intermediate term effects on measured CPI inflation are ambiguous—an increase in multi-family starts might cause average rents to decline even as housing shortages increase.

Disclaimers:
This commentary has been prepared by Dr. Andrew Weiss and reflects the opinions of Dr. Weiss. This is not an offer to sell, nor a solicitation of an offer to buy any security of any fund (a “Fund”) managed by Weiss Asset Management LP or its affiliates (“WAM”) or any other investment product or strategy.  Offers to sell or solicitations to invest in a Fund are made only by means of a confidential offering memorandum and in accordance with applicable securities laws.  An investment in a Fund involves a high degree of risk and is suitable only for sophisticated investors that are qualified to invest therein. Commodity trading involves a substantial risk of loss.

This commentary may not be reproduced or further distributed without the written permission of Dr. Weiss.  This material has been prepared from original sources and data believed to be reliable.  However, no representations are made as to the accuracy or completeness thereof.

Although not generally stated throughout, this commentary reflects the opinion of Dr. Weiss, which opinion is subject to change and neither Dr. Weiss nor WAM shall have any obligation to inform you of any such changes.

This commentary includes forward-looking statements, including projections of future economic conditions. Neither Dr. Weiss nor WAM makes any representation, warranty, guaranty or other assurance whatsoever that any of such forward-looking statements will prove to be accurate.  There is a substantial likelihood that at least some, if not all, of the forward-looking statements included in this commentary will prove to be inaccurate, possibly to a significant degree.
Is “All that We Have to Fear, Fear Itself”?

Introduction

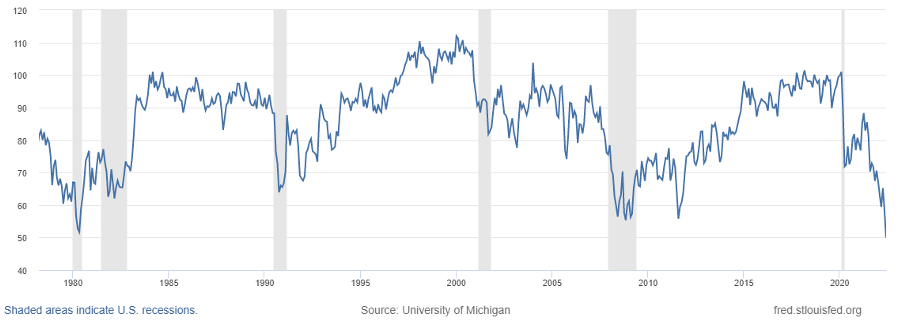
The greatest risk to the economy is the extreme levels of pessimism regarding the prospects for the economy.1 If consumers stop spending and firms stop investing because they fear a recession, that could cause a recession.2 Sentiment can be self-fulfilling.

University of Michigan Index of Consumer Sentiment3

These levels of sentiment are at odds with data on economic conditions.

The labor market is extremely strong. The unemployment rate is at 50 year lows. While job openings have fallen (due in part to openings being filled from increased employment) the rate of job openings as a percentage of employment remains well above the levels seen prior to 2021. Profits as a fraction of GDP and as a fraction of hours worked are high, as are quit rates. The high rates of job openings, quit rates, and high profits of firms are likely to cause wages to continue to rise, increasing firm costs and increasing aggregate demand, both of which will lead to higher prices.

Financial conditions are also robust. Debt service payments as a fraction of disposable income are below historical levels. Delinquency rates on credit card debt are far below their historic averages, and are below any levels reached prior to the pandemic. Default rates on business loans are very low. Firms have high levels of retained earnings, and are continuing to make capital investments. The strong balance sheets of firms will cushion them against falls in demand. As discussed below, firms could be vulnerable to higher interest rates on loans; however taking everything into account, there does not seem to be the fragility in the economy that we would expect if the sentiment indicators in the Michigan consumer confidence survey reflected the actual conditions of the economy.4

Federal Reserve policies will be less effective than they have been in the past. Manufacturing and particularly motor vehicle production, as a fraction of employment, is much smaller than when the FED last tightened significantly. Along with residential construction, these are the main venues through which interest rates affect the economy. The “fly in the ointment” is the high levels of business loans to nonfinancial corporations—roughly $4.7 trillion dollars. These are likely to be variable interest rates loans and the borrowers could respond to higher interest rates by retrenching—reducing employment and cutting investment.

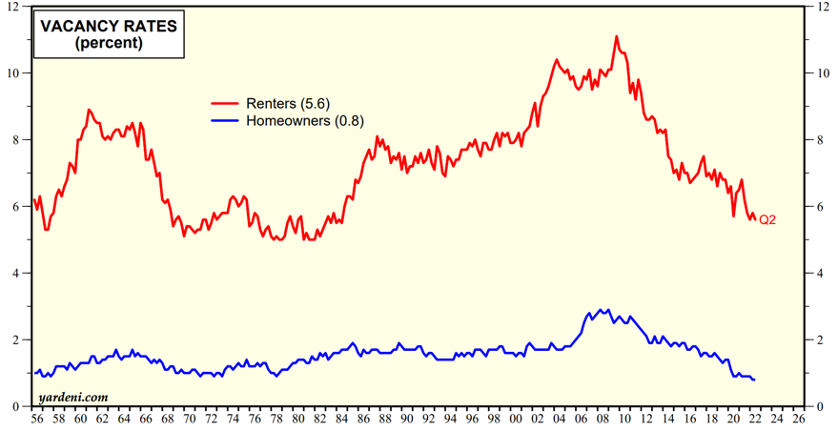
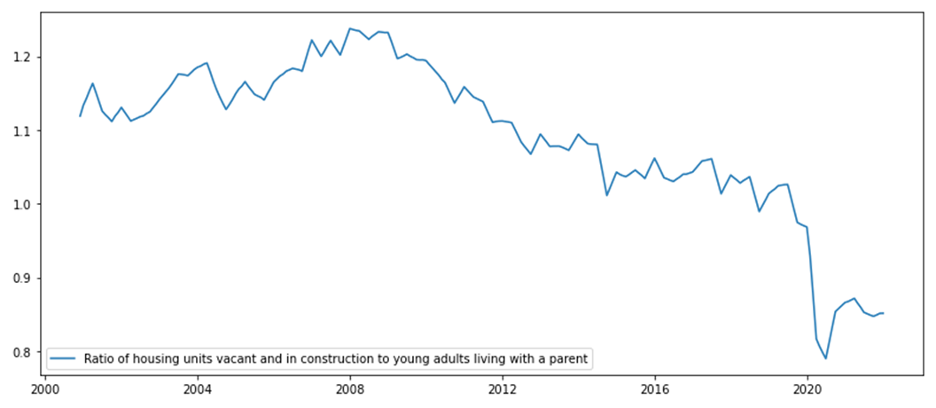
Low vacancy rates on homes and on rental properties, as well as the projected increases in household formations and the bruited supply shortage of housing may, in the short run, dampen the effect of higher interest rates on employment in the construction industry. Average rents are likely to continue to increase at a high rate as they catch up to the large increases in rents on new leases that we’ve seen in the last several quarters. The rents on new leases may themselves continue to increase as they gradually converge to their historical relationship to the cost of home ownership, which has increased much more than rents on new leases. On the other hand, the supply of partially completed homes may dampen pressure on home prices, while sustaining demand for furniture and appliances.

Thus, based purely on economic fundamentals, the likelihood of recession seems small. On the other hand, sentiment about the economy is at historic lows.5

Many of the same factors that point to a low probability of recession will make it difficult for the Fed to substantially reduce inflation. In addition to the high levels of labor demand, there is the embedded tailwind from the effect of average rents, which is a major component of CPI. Working in the opposite direction are the futures markets forecasts of falls in energy prices and commodities more generally, as well as a strong dollar lowering the cost of imported goods. I believe the net effect is that it will be very difficult for the Fed to reach its inflation target without either very high interest rates, or pessimistic sentiment itself causing a recession.

Continued Labor Market Tightness

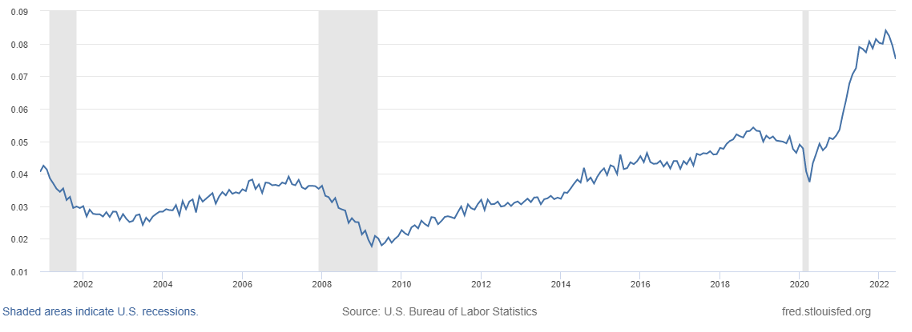
There has been considerable attention placed on limitations on the availability of some goods such as some models of motor vehicles, but there may also be supply constraints in services due to limited availability of workers causing limited hours of service or lower quality of service—which is a form of supply rationing. Most strikingly, the private sector job openings rate (the ratio of job openings to total employment) remains at very high levels, although it has fallen from its peak of 8.4%. It is 7.8% of the private sector work force, which is roughly twice its average going back to 2000, when data on job openings was first collected. Prior to January 2021, private sector job openings had never exceeded 5.4% of the labor force. The fall in job openings is somewhat less than might be expected from the increase in employment. In the years prior to the pandemic, private sector job openings were in the neighborhood of 5%.

Private Sector Job Openings as a Fraction of Private Employment6

Private Sector Quit Rate7

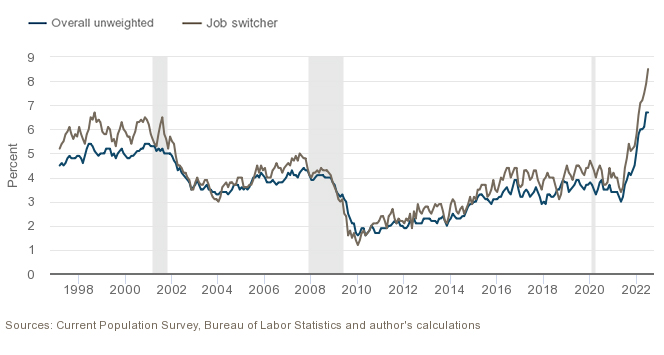
According to the Atlanta Fed, median wages for the panel of people they follow are around 6.7% higher in the last 3 months than in the same three month period a year ago. For job changers, the wage increase is 8.5%. While these are large increases relative to previous months, wages are still substantially lagging inflation.8

Three-Month Moving Average of Median Wage Growth, Hourly data9

These unfilled jobs could be reflected in an inability for restaurants to serve potential patrons. For example, spending in restaurants could be depressed by restaurants not having available seating or having shorter hours and being closed on more days due to labor shortages. Anecdotally, two Dunkin’ Donuts outlets in central Massachusetts did not have donuts on a recent weekend. In Martha’s Vineyard, the local newspaper is reporting restaurant closings during the prime vacation season due to lack of staff. Confirming evidence about sales being constrained by insufficient supply rather than insufficient demand comes from the high ratio of corporate profits to hours worked.

Normally, the volume of sales reflects demand—falls in sales is a measure of falls in demand, but we are not in normal conditions. We are in conditions in which supply in various sectors is being constrained either from shortages of parts, as in sales of motor vehicles and electronics, or shortages of workers—reflected in reduced hours for some service providers and reduced quality of service for airlines, hotels and other similar service providers. If sales are depressed due to insufficient supply, this should drastically change our interpretation of economic data. Rather than low sales being a harbinger of a recession, the low sales could reflect unsatisfied demand that will support demand in the face of what would otherwise be contractionary monetary policy. Thus, the economy may be less responsive to policies that depress demand than would normally be the case.

Additionally, unspent funds from the infrastructure bill, investment induced by the semiconductor bill, and the likely increase in defense spending in light of the activities of China and Russia are all likely to be putting additional pressure on demand for workers. Note that because of the high rate of job openings, even if there is a fall in labor demand in some sectors of the economy, the dismissed workers may enable firms that are suffering labor shortage to increase employment.

Despite increasing nominal wages, real wages have been falling, which has depressed consumer demand; this dampening effect on inflation is unlikely to persist.10 If firms increase the monetary compensation of workers in response to supply shortages, that would increase pressure on prices and increase demand due to the relatively high marginal propensity to consume of those workers.

Household Balance Sheets

While the stock market is down substantially this year, the average consumer (weighted by consumption) has most of their wealth in housing, not the stock market, and if we go back five years, stock markets have performed extremely well. Since the wealth effects on spending typically have long durations (the increase in wealth is spent over many years), the fall in the stock market would have its main effect through changes in sentiment (people may retrench their spending out of a fear of recession) rather than the direct effect of changes in wealth on spending. As discussed in the introduction, high levels of pessimism about the economy among consumers is the main reason we might experience a recession.

The media has reported increases in consumer debt. This is highly misleading. Credit card balances are down. What is up is mortgage debt and auto loans. This is a natural consequence of the increases in home prices and car prices. As opposed to credit card debt or student loans, these are collateralized loans. The high prices of homes and of used cars means that the collateral value is quite good. Borrowers could sell the assets if they needed cash. In addition, the credit ratings for borrowers have been higher than was historically the case.

Household Debt Service Payments as a Percent of Disposable Income11

Delinquency Rate on Credit Card Loans12

Household debt service payments have not fallen as much as the fall in interest expense. This is because the increase in housing prices, and to a lesser extent recent increases in mortgage rates, have largely offset the decrease in the average interest rates on mortgages as homeowners refinanced their homes at lower rates during the years after the great financial crisis.

There was a considerable increase in household savings from the stimulus packages. Cumulative excess savings remains high: the recent fall in the savings rate is much too small to have made a significant dent in the excess savings accumulated during the pandemic.

Furthermore, cumulative excess savings is understated. People shifted their consumption during the pandemic toward buying goods (and especially imported consumption goods) rather than consuming services. This may be in part due to consumers anticipating that prices will rise faster than the interest rate on their savings and rationally choosing to deplete their savings (and/or defer spending on services) in order to purchase items today that they intend to consume in the future.13 While they are classified as consumption, expenditures on goods can be a form of savings. These purchases need not be durables. They could be staples with long shelf life such as pet food or groceries or semi-durables such as clothing. Purchases of more energy efficient appliances or motor vehicles with lower maintenance costs can increase future discretionary spending, and thus can be considered a form of savings in which the reduction of the cost of usage is the return on savings.14 These increased holdings of durables and semi-durables all generate use value over many years.15

To see this, consider a person choosing between leasing a Toyota (and paying for the lease through the interest and dividends on their savings) or buying the Toyota by depleting her savings.16 If she buys the car, her reported savings are reduced as is her income from savings, but, aside from tax effects or the differences in costs of leasing versus owning a vehicle, there has been no real change in her economic conditions: her consumption is unchanged as is her discretionary income.17 There are similar biases in the data for measures of savings rates when vacation homes or RVs are purchased, or more generally, for any purchases that deplete savings or increase debt but that generate use value and thus make more disposable income available to be spent in other ways.18

In the first seven months of 2022, spending on imported consumer goods (other than motor vehicles and parts, which are reported separately since they are a mix of consumer goods and purchases by businesses) increased by $75 billion—an 18% increase over the same period in 2021 (this is not seasonally adjusted). Spending on automotive vehicles and parts increased by $19.6 billion, almost a 10% increase.19 These increases are due to a combination of a stronger dollar that made imports cheaper, and greater demand for goods versus services during the pandemic.

Much of the income from purchases of goods accrues to foreign producers. They are unlikely to spend much of that income on increased purchases of U.S. goods and services. Consequently, increased spending on imported goods has served as a release valve for inflationary pressures: to some extent the U.S. has been exporting inflation through the effect of the stimulus packages on spending on imported goods.20 Furthermore, to the extent that purchases of domestically produced goods displaced purchases of services and caused the increase in the profits of domestic firms, purchases of goods versus services has had a dampening effect on aggregate demand.

High demand for goods has led to increased savings by those firms as well as share repurchases and increased dividends. Those cash outflows accrued to shareholders and owners of private firms. Shareholders of firms are largely institutions or high net worth individuals who have relatively low marginal propensities to consume. In contrast, when people hire a personal trainer for example, the money they spend is directly reflected in the income of the trainer. This income is much more likely to be spent on domestic goods and services than when people buy clothes or electronics or other goods in which case some of the income accrues to the profits of the firm which may be saved or paid out in dividends or in the form of share buybacks, while in other cases the recipients are foreign workers and shareholders.

Even for domestically produced goods, much of the value added comes from imported inputs. It is difficult to think of any domestically produced consumer goods that do not embody imported inputs, which are not included in the data on imported consumption goods. To the extent that production of goods is less labor intensive than production of services, purchases of even wholly domestically produced goods are likely to have a smaller stimulus effect than purchases of services. Thus spending accrues largely to people who will turn over that money through domestic purchases—hence the multiplier effect.

If demand for consumption goods gets saturated and people switch to buying domestically produced services, there could be increased pressure on prices: spending on services will be recycled in the domestic economy through further spending. The increase in demand for services could be disproportionately large due to the accumulation of durable and semi-durable goods during the pandemic.

Corporate Balance Sheets

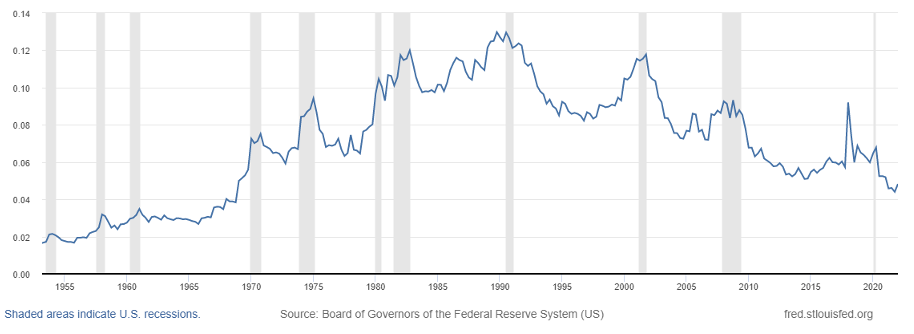
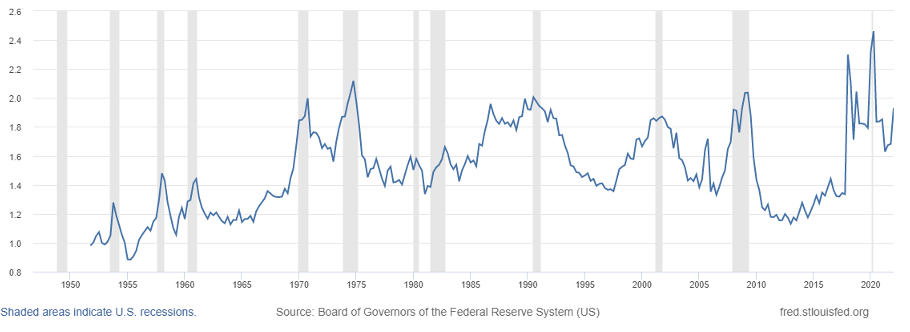
One way a recession is precipitated is when firms feel under pressure to retrench and conserve cash. This is more likely to happen if their interest payments are a large fraction of EBIT (earnings before interest and taxes) which is a reflection of their ability to meet interest obligations during a business downturn. This ratio is very low by historical standards which would suggest that at current interest rates the economy is quite robust.

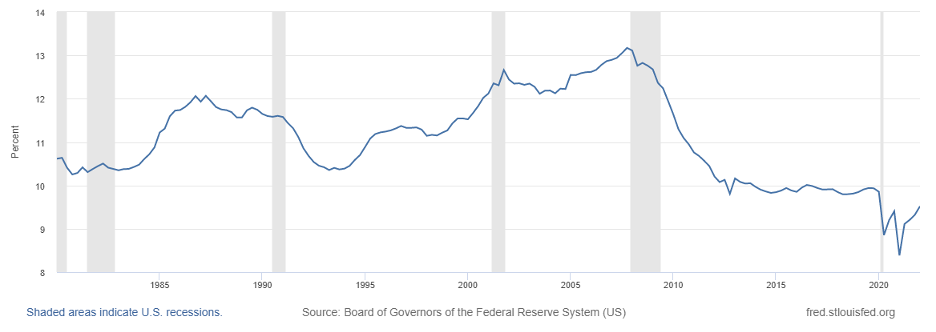
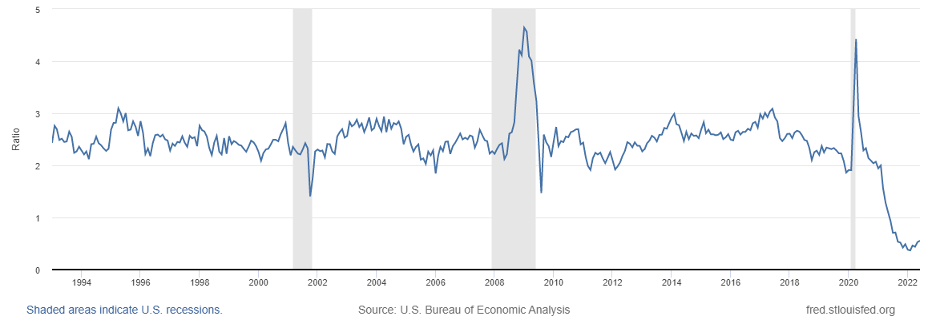
Ratio of Interest Payments to EBIT for Nonfinancial Corporations21

Firms are not very leveraged by historical standards: despite a recent uptick, the ratio remains the lowest in the last 20 years. This suggests that the low interest rate payments to EBIT are not solely a function of low interest rates but are also a function of less leverage. Of course, interest rates are not fixed: the Federal Reserve is increasing interest rates and the rates corporations have to pay on new bonds has increased.

Ratio of Debt Securities and Loans Less Liquid Assets to EBIT for Nonfinancial Corporations22

The effect of increases in interest rates on the financial conditions of firms depends critically on the maturity of their bonds, and the amount of bank loans and other floating rate debt.

Roughly 80% of corporate bonds are investment grade,23 and for those companies, average maturity is more than eleven years. The average maturity for the debt of high yield bonds is around six years.24 The relatively long duration of bonds means that the main effect of interest rates on corporate solvency will be through the increases in the interest rates on bank loans and other floating rate debt.

Effects of Interest Rate Increases on Consumer Demand—Why This Time May be Different

Historically, moderate increases in interest rates have their main effects on the demand for motor vehicles and housing. However, tightness in these markets may reduce the effectiveness of monetary policy. The seasonally adjusted level of inventories of motor vehicles to sales is 0.55; this is around 1/5 of historical levels.

Automotive Inventory to Sales Ratio25

Car rental agencies have limited supply and many vehicles are back ordered and often sell for above MSRP. Thus, we would expect that the impact of increases of interest rates on motor vehicles production to be less than in the past.

More generally, the U.S. economy has become much less reliant on the manufacturing sector than it was prior to the last major bout of inflation and the Volker interest rate hikes that squelched inflation. Note that at its peak in 1979, U.S. employment in manufacturing was 19,553,000 or 26.4% of the private labor force; it is currently 12,826,000 or 9.8% of the private labor force.26

Turning to housing, as mentioned previously, there are two measures that are outliers based on historic data: the vacancy rate for houses is very low, and there is a large stock of partially built houses that are likely to be completed. The stock of partially built housing will alleviate the price pressures from the low vacancy rates, but will generate some labor demand to complete those houses and to furnish them. Much of the increase in the cost of housing comes from large increases in the cost of land (including development costs). As higher interest rates depress demand for housing, this may show up in lower land prices which could mitigate the effects of higher interest rates on aggregate demand in the economy.

Investors may be subconsciously influenced by media accounts of softening in the demand for houses. However, due to the way the housing component of the CPI is calculated, increases in mortgage rates could cause inflation as measured by the CPI to increase. The cost of new homes is not included in current measures of the CPI, only imputed owner-occupied rents, which is computed from average rents. Therefore, even if the cost of construction were to fall, but average rents were to increase, the housing component of the CPI would show a price increase.

Historically, rents tend to rise with increases in interest rates and home prices: presumably increases in the monthly cost of home ownership causes renting to become more attractive relative to buying a home and thus leads to higher rents. These effects can have long lags and are sensitive to beliefs about future home prices and the supply of rentals. Average rents tend to change slowly since most rental contracts are long term contracts and landlords tend to increase rents for renewing tenants by less than for new leases. The risk of a recession and the concomitant increase in the risk of falls in home prices may also increase the demand for rental properties.

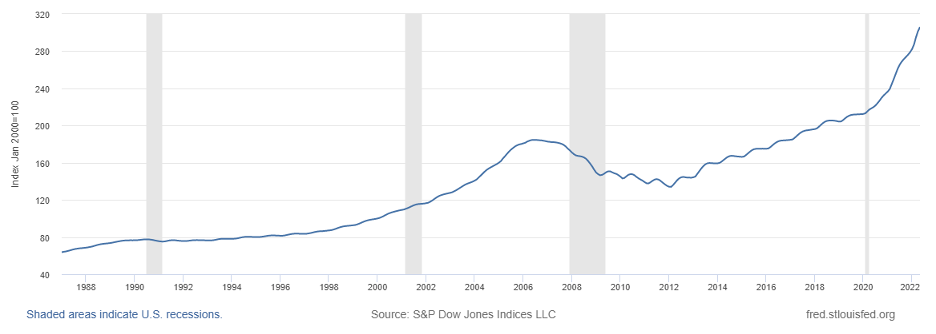
S&P/Case-Shiller U.S. National Home Price Index27

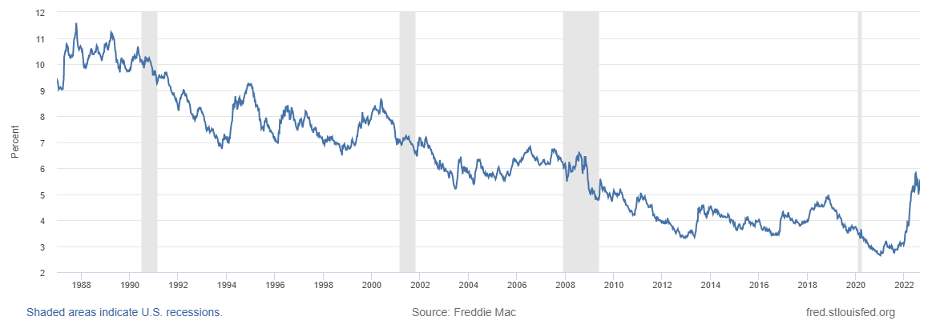
U.S. 30-Year Fixed Rate Mortgage Average28

The recent increases in the rent on new leases are dwarfed by the much larger increases in the cost of home ownership due both to much larger increases in mortgage rates and increases in home prices that have also exceeded the change in price of new leases, albeit to a lesser extent (Case-Shiller shows about an 18% increase in prices of the same home over the last year). As leases expire, rents on new leases are likely to continue to increase due to the substantially increased costs of homeownership and rental vacancy rates that remain below pre-pandemic levels. To the extent that increases in real estate prices and interest rates outweigh the increase in rent on new leases, this will also discourage construction of rental properties and exacerbate the housing shortage, putting further pressure on rents.

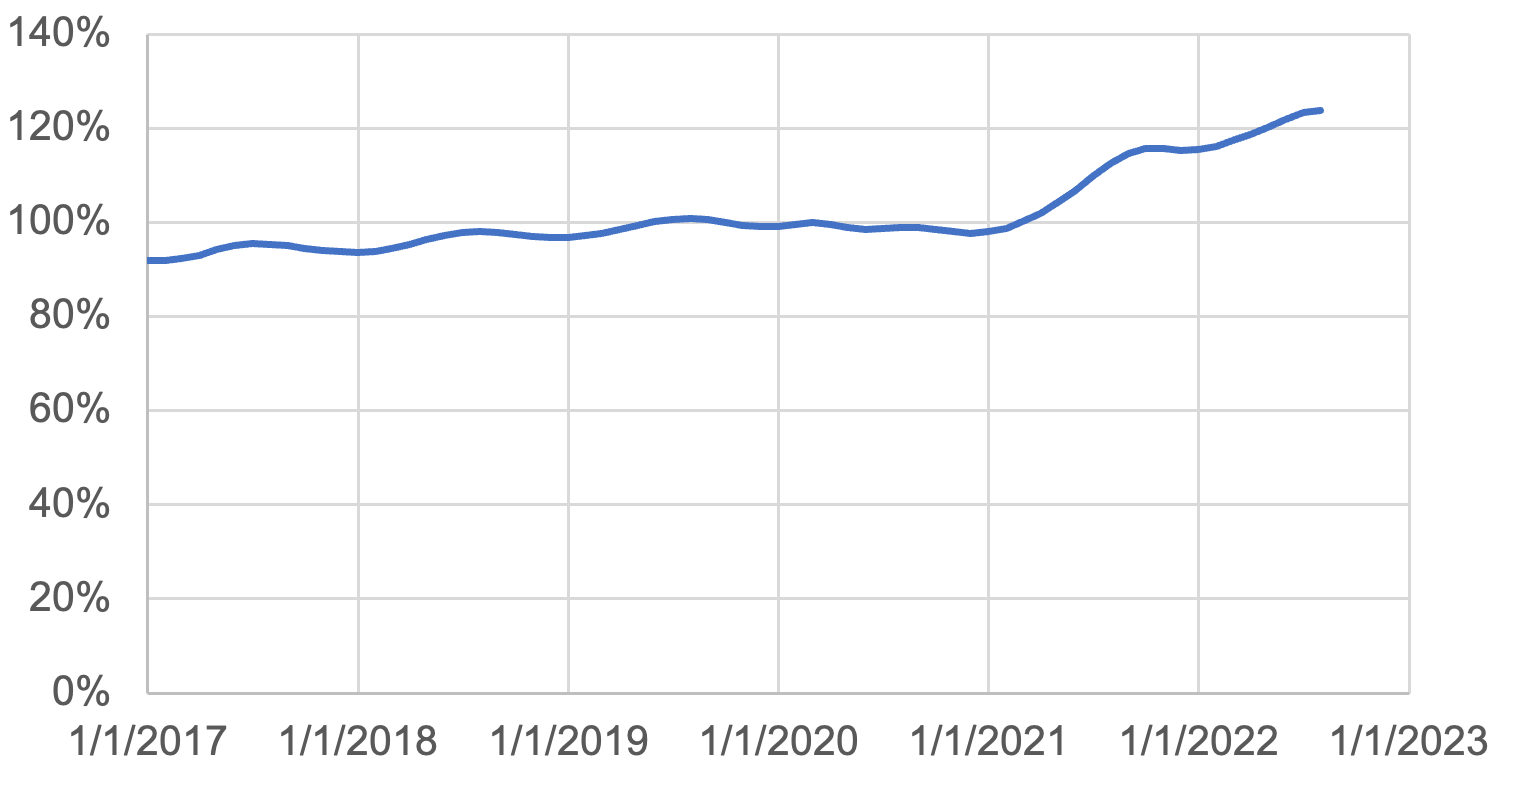
Median Rent on New Leases, Relative to March 202029

Vacancy Rates: Renters and Homeowners30

However, even if the cost of new leases were to level off, the effect of new leases charging higher rents than existing leases would continue to put pressure on inflation. The CPI’s high weighting of average rents (31.6%, including both actual and imputed rent for owner-occupied residences) means that this lag can have a meaningful effect on measured CPI. If average rents were to increase by 7.5%, which is our internal estimate of future annual increases in average rents, that would generate 2.4% inflation on top of whatever price increases we might see for other components of the CPI.

In the long run, if higher interest rates cause a decrease in home construction, that will exacerbate the imbalance in the supply and demand for housing and put additional pressure on rents for several years in the future. These effects on home construction could happen sooner if the Fed continues to be aggressive in increasing interest rates, and if the unwinding of its asset portfolio—particularly its holdings of Mortgage Backed Securities “MBSs”—keeps the cost of buying a home high relative to the current cost of renting.

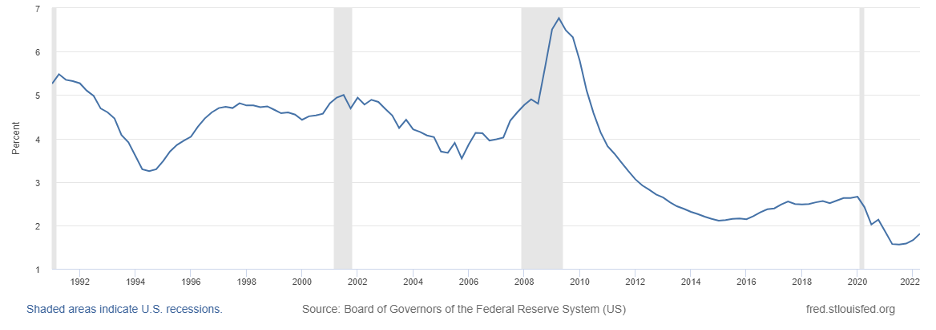
One troubling way in which higher interest rates could cause a contraction in the economy is through adverse effects on businesses with variable interest rate loans. The ratio of loans to EBIT of nonfinancial corporations is troubling.31 It is relatively high by historical standards; it is higher than in the months preceding the great financial crisis.

The low default rates on bank loans could indicate either higher levels of safety (that the banks were lending to better borrowers) or the opposite: that the low default rates were due to low interest rates and easy credit “extend and pretend” that have allowed unprofitable companies to stay in business. When interest rates rise those companies may go bankrupt, or at a minimum, layoff workers and curtail investment—the proverbial “tide going out revealing who is swimming naked.”32

Ratio of Loans to EBIT for Nonfinancial Corporate Business33

I’m not sure to what extent this is a residual effect of the subsidies for bank loans in the 2020 legislation. Some of those loans have been forgiven (which may explain the more robust financial balance sheets of firms) but others may still be outstanding. The outstanding loans may be a function of fraud—which appears to have been widespread and thus those loans may not be owed by firms with real businesses. However, taken at face value the high ratio of commercial and industrial loans to EBIT could make the economy more vulnerable to higher interest rates.

On the Demand Side—Short Term There May Be Falls in the Prices of Some Goods

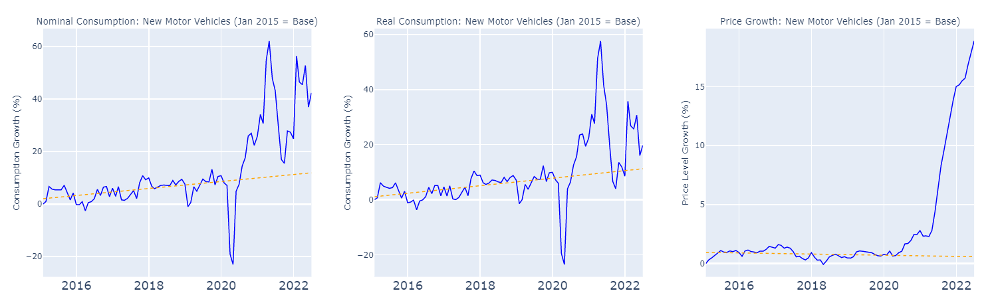
While we are seeing falls in sales of goods, sales of goods are still well above trend. The data for various categories of goods are graphed in the appendix. Note that these trends may understate the cost of inflation. The composition of motor vehicles being sold has changed: the auto manufacturers are producing the more expensive models that have higher mark-ups. This is in part showing up in low purchases of motor vehicles by businesses—that presumably may be more sensitive to being forced to buy options that don’t increase resale value. Spending on the more expensive models that offer options that the consumer would not buy if given the choice is a form of inflation that is not captured in the data. Total spending on motor vehicles (even adjusted for price moves) has increased compared to trend despite the fall in the number of vehicles sold. The average sale price has increased from around $35,000 to over $47,000. To the extent that fewer cars were sold to businesses and inventories are very low, demand for new cars might continue to be high even if interest rates on car loans were to increase substantially. This may also be true for other items that had limited supply and are on back order. Even ignoring the fact that basic cars are often unavailable and so the quality adjustment causes price inflation to be understated, the cumulative increase in prices of motor vehicles has been dramatic. If the prices of new and used cars were to revert to trend, that would cause a significant fall in the CPI.

If futures markets are accurate predictors, we should also expect to see falls in commodity prices—which will either directly affect consumer prices as in the case of gasoline or indirectly affect the prices of goods and services that use the commodity as an input. Of course, the futures market may be wrong and geo-political events could cause commodity prices, and especially energy prices, to soar. However, in the absence of expertise on our part, I would not want to second guess the specialists who are trading the futures in particular commodities.

The futures market is pricing a steady fall in gasoline prices through 2025 (albeit with seasonal variation); futures also predict falls in the prices of diesel and aviation fuel. However, since consumers of gasoline have a higher marginal propensity to consume than do oil producers and refiners, lower prices of gasoline will increase discretionary income. This is likely to increase spending on other goods and services. Since spending on services (and to a lesser extent, spending on other goods) has stronger effects on aggregate demand than does spending on gasoline—since the suppliers of those goods are more likely to spend the income than are the producers of gasoline—the lower price of gasoline could perversely have longer run inflationary effect. I realize that this argument is contrary to the conventional wisdom which is that lower gas prices are disinflationary. I would think of gasoline prices as having a similar effect on aggregate demand as a gasoline tax that is paid as a subsidy to producers. This tax/subsidy would probably not be viewed as having a long run inflationary impact. On the other hand, decreases in the price of diesel fuel, which is more heavily used in construction vehicles and heavy-duty trucks, are likely to be disinflationary as those cost reductions work their way through the supply chain. The effects of aviation fuel price declines on future inflation are also likely to be disinflationary, as are lower costs of other commodities.

Note that historical data of the effect of interest rates on inflation is heavily influenced by years in which domestic manufacturing was a larger fraction of GDP. For consumers of gasoline, a higher price serves as effectively a tax on consumers and subsidy to the producers. It creates comparatively few jobs in oil production relative to spending on services. The main takeaway should be that falls in headline inflation from falls in fuel prices should not be taken as predictive of future disinflation—the opposite could be true.

Embedded Persistence in Inflation from Medical Services

In addition to the lags in changes in the housing market being incorporated into inflation measures (due to using average rents), there are lags in the changes in prices that insurance companies and Medicare and Medicaid pay for medical services. Prices for medical services are negotiated on long-term contracts between payers (largely insurance companies and the federal government) and hospitals, so that prices are slow to respond to changes in the cost of providing services. This is particularly relevant to the PCE, which is a favored inflation measure of the Fed. While the PCE gives much less weight to average rents (only around 16%) than does the CPI, it gives much greater weight to medical services—especially services provided in hospitals.34

Anecdotally, I’ve been told that patients are sicker and staying longer in the hospital for the same procedures—this may be due to postponed treatments due to COVID and to weight gains during the pandemic. Also, outpatient facilities often have no capacity, which requires the hospitals to keep patients longer, all of which increases costs.

The government is unlikely to enforce prices that force hospitals into bankruptcy, and unless the insurance companies raise payments to cover the cost of providing medical services, hospitals and physicians will refuse to accept their insurance for elective procedures. Even prior to the pandemic, the compensation rates were such that some physicians and psychologists refused to accept Medicaid or Medicare and some even refused to accept patients covered by insurers who had low payment rates. Being excluded by the most skilled providers would seem likely to cost the insurers customers among firms. For publicly traded firms and state and local governments, the people who choose the insurers are themselves benefitting from the insurance, but the costs are paid by shareholders or taxpayers. Furthermore, limited availability of Medicare providers could cause political problems for government officials: the elderly are a particularly vocal and powerful interest group.

Conclusion

I think that the media and pundits are overestimating the likelihood of a recession. The economy is more robust than it was prior to other recessions. The models being used are only gradually incorporating data on job openings and quits. Data on job openings and quits were not available before 2000, thus they were not included as explanatory variables in the macro-economic models taught in graduate school, and it is taking time for them to be incorporated into the models. The high levels of job openings would appear to present an economy with much more resilience to falls in demand than is forecast by models that omit those data.

Regarding inflation, quits and job openings are perhaps the two best predictors of future changes in labor costs. Their omission in the standard models may have led to underestimates of inflation. Anecdotally we are seeing more reference to job openings (but not to quits) in the media which may reflect their inclusion in the forecasts of inflation—this could explain why forecasts of inflation have increased sharply in August.

Because increases in interest rates have their main effects on demand for housing and motor vehicles, and since the motor vehicle sector is a much smaller share of the economy than in the past, the fall in demand would have to large enough to overcome the extraordinarily low levels of vacant housing and motor vehicles. The government deficit is projected to be around 6% which will provide additional fiscal stimulus.

The main sources of concern are the poor sentiment readings (which have improved but are still lower than would be expected from the economic fundamentals). Fear of recession could cause a recession. Another risk factor is the fall in real wages which will eventually cause savings to be depleted and lead to falls in aggregate demand.


Sincerely,

Andrew Weiss  |  CEO, Weiss Asset Management


Appendix

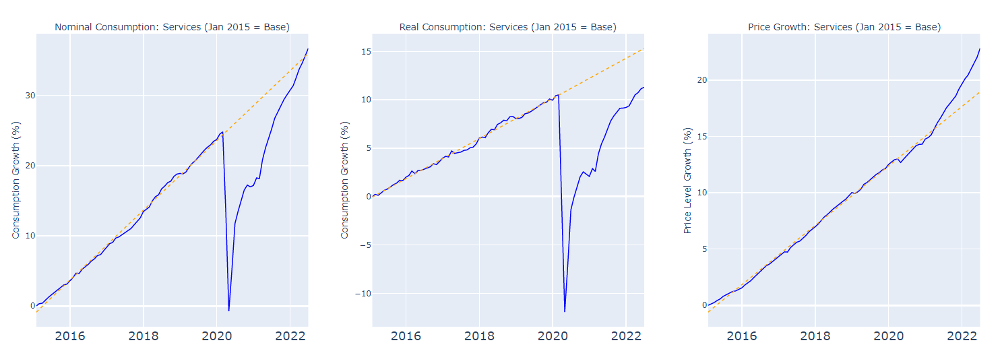
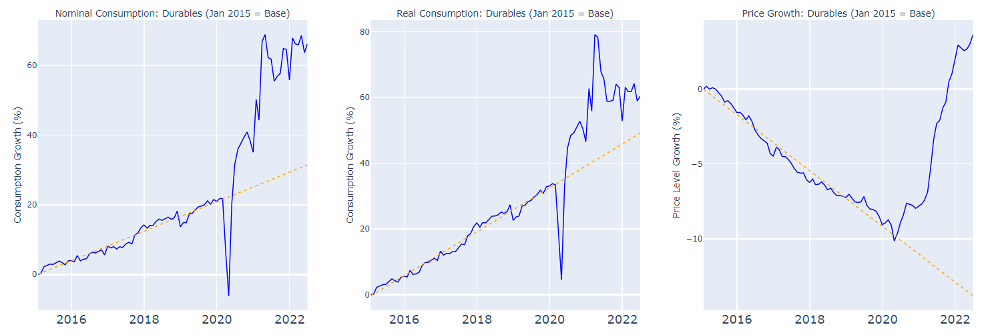
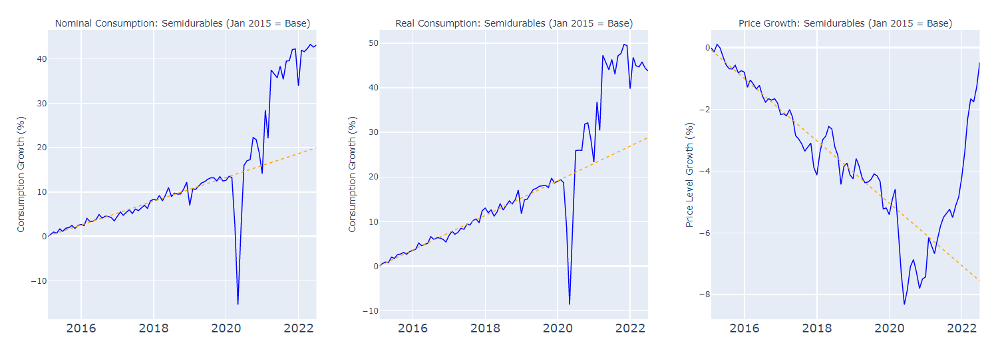
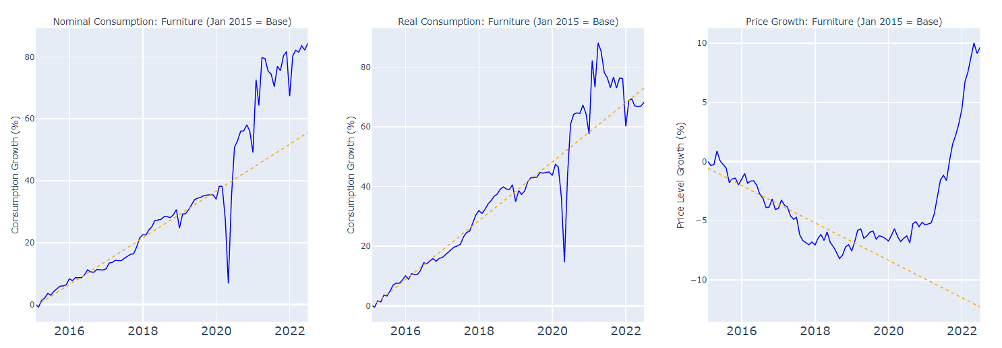
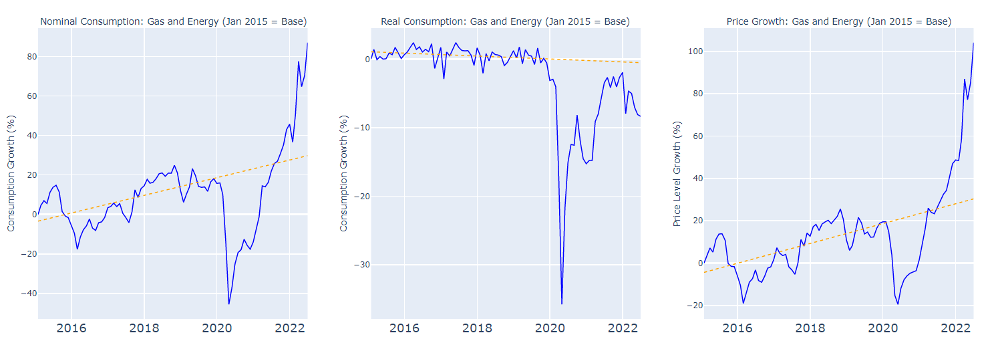
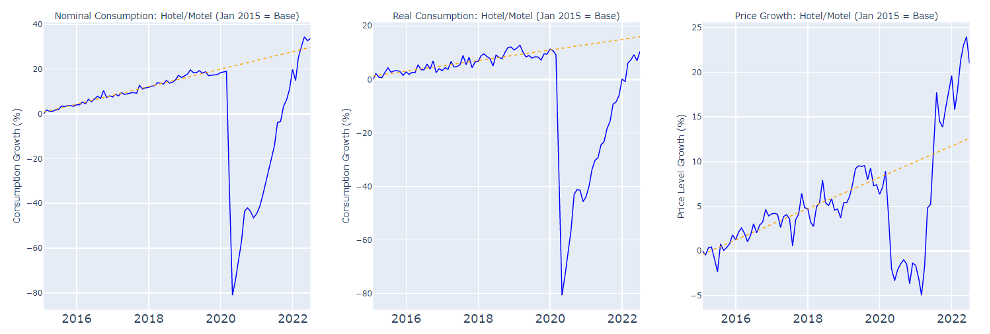
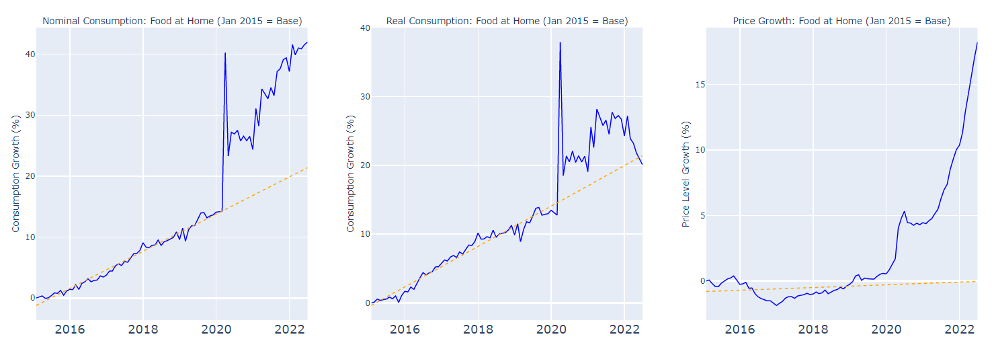
Selected Personal Consumption Expenditure Components: Changes in Real and Nominal Spending and Price Levels vs. Pre-2020 Trend Line


Disclaimers:

This commentary has been prepared by Dr. Andrew Weiss and reflects the opinions of Dr. Weiss. This is not an offer to sell, nor a solicitation of an offer to buy any security of any fund (a “Fund”) managed by Weiss Asset Management LP or its affiliates (“WAM”) or any other investment product or strategy.  Offers to sell or solicitations to invest in a Fund are made only by means of a confidential offering memorandum and in accordance with applicable securities laws.  An investment in a Fund involves a high degree of risk and is suitable only for sophisticated investors that are qualified to invest therein. Commodity trading involves a substantial risk of loss.

This commentary may not be reproduced or further distributed without the written permission of Dr. Weiss.  This material has been prepared from original sources and data believed to be reliable.  However, no representations are made as to the accuracy or completeness thereof.

Although not generally stated throughout, this commentary reflects the opinion of Dr. Weiss, which opinion is subject to change and neither Dr. Weiss nor WAM shall have any obligation to inform you of any such changes.

This commentary includes forward-looking statements, including projections of future economic conditions. Neither Dr. Weiss nor WAM makes any representation, warranty, guaranty or other assurance whatsoever that any of such forward-looking statements will prove to be accurate.  There is a substantial likelihood that at least some, if not all, of the forward-looking statements included in this commentary will prove to be inaccurate, possibly to a significant degree.
What Standard (and Even Sophisticated) Models of Inflation are Missing

As discussed in the Q2 2021 letter, we thought inflation would be higher than what markets were implying as well as what the Federal Reserve was forecasting. For 2023 and beyond, I believe there is a significant probability that inflation and interest rates will be much higher than what is being predicted by the Federal Reserve or the professional forecasters.  Incidentally, my forecasts of higher interest rates are somewhat lower than the interest rates provided by the Taylor Rule which prior to the pandemic tracked the federal funds rate very well, and which in each of the three default alternatives chosen by the Atlanta Fed is dictating a federal funds rate in the 7% to 8% range. John Taylor is also personally advocating for very large increases in the Federal Funds rate to maximize the utility of households.1

I have several reasons for thinking that inflation is going to be higher than the Federal Reserve is predicting. They mainly involve problems with the inflation model used by the Fed and by professional forecasters. I will also be discussing the ability of the Federal Reserve to address inflation under current conditions. I will conclude with a discussion of how my analysis could be mistaken: in particular the reasons there may be a large increase in private saving or unanticipated increases in private output that could offset the supply/demand imbalances that would otherwise be driving inflation.

What is omitted from this discussion is any treatment of recent events in Ukraine and the sanctions against Russia. This omission is not because I think that these events will have no major effects on inflation and on interest rates, but rather because I don’t think that at the present time I have anything interesting to say about how the Federal Reserve will respond to higher commodity prices. I would, however, point out that Russia produces around 40% of the world’s palladium and that its main use is in catalytic converters; thus a curtailment of exports of palladium from Russia could meaningfully affect the car industry.

A Critique of the Standard Phillips Curve Model

There are several problems with the standard Phillips model, which macro-economists use to forecast inflation. At the core of the basic Phillips curve model is the assumption that future inflation can be forecast using a linear function of three variables: the current inflation rate, expectations of future inflation, and the ratio of unemployment to the natural rate of unemployment. It assumes that the linear relationship that is estimated from past data (plus some controls that each modeler adds to their basic model) will predict future inflation.

There are some fundamental problems with this approach. Not only is the functional form of the model ad hoc but important drivers of inflation are omitted. Among the factors omitted in the standard model that I shall discuss as affecting future inflation include the following: excess savings of households, wealth effects on future spending from the increase in housing prices, equity prices and bond prices; lagged effects of the Consumer Price Index for Urban Wage Earners and Clerical Workers (“CPI-W”) on retirements and spending by retirees;2 future budget deficits and their effects on spending; effects of the Fed broadcasting its expectations of a series of future interest rate increases (these announcements could cause households to increase home purchases to lock in low mortgage rates or conversely to increase savings and decrease debt due to a fear of a “hard landing”); private sector quit rates and job opening rates that are not captured by the unemployment rate; rationing of manufactured goods; large recent increases in commodity prices.

Fundamental Problems with the Model and Omitted Variables

The economy is changing so relationships that held in the past may not hold today. It has been roughly 40 years since we last had inflation at the levels we are currently experiencing.3 Job openings and private sector quit rates are higher than they’ve been since those data were first gathered. Real interest rates are far lower than anything we have seen in the past. The federal government deficits are higher than any peace time levels. The aggregate stock of assets held by the Federal Reserve and other central banks relative to GDP of the relevant economies is higher than anything we have ever experienced. Forecasts by professional forecasters are typically based on data that does not include the extreme economic conditions we are currently experiencing as determinants. Their empirical models instead extrapolate from the data that is available. These extrapolations are likely to be unreliable. For instance, historically government deficits in peace time were small relative to what we have experienced in the last two years, and the revenue shortfalls were due either to tax cuts to wealthy individuals with low marginal propensities to consume, or falls in revenue due to a recession and its aftermath hurting tax collections and increasing spending on entitlements. (During World War II there were price controls.)

Economics is not physics. We don’t run experiments on the economy, and natural experiments can’t be relied upon since market participants will learn from that experience and respond differently the next time similar conditions arise. On the other hand, we should not ignore all the data from the past. It is useful, but should be used judiciously.

While we need to rely on some estimates from past experience, we should keep in mind that the current economic environment is very dissimilar to what we have seen in the past. Rather than relying on bad models to get precise but highly inaccurate and possibly highly biased estimates of future inflation and interest rates, it could be more productive to think broadly about what factors are likely to be affecting interest rates and inflation in the next few months or years.

My basic assumption for predicting interest rates is that over long periods of time prices tend toward equilibrating supply and demand: if there is serious excess demand at current prices I’d expect prices to increase, unless the Fed responds to the indicators of forthcoming inflation by causing a deflationary recession.4 Later in this missive, I shall also address the question of how effective interest rate policy will be in halting inflation under current economic circumstances.

Deficit Spending

The U.S. federal deficit is forecast by the Economist Intelligence Unit to be 7.4% of GDP in 2022.5 This estimate came out when predictions of increases in interest rates were much lower. The expected increase in interest rates will boost the deficit; furthermore the end of QE and the possible sale of securities by the Federal Reserve will decrease payments by the Federal Reserve to Treasury and thus further increase the budget deficit.

While starting after the end of the Clinton administration the government has been running deficits, and those deficits have been growing, they have been modest fractions of GDP relative to the size of deficits in recent years (the implied deficits from future social security obligations were large but so too were the predicted future gains in GDP).6 The increase in deficits in recent years aside from deficits during the global financial crisis and the recent pandemic were generated largely by reductions in the top tax brackets for individuals, and the 2017 cuts in the corporate profits tax. The corporations used most of the revenue either to increase their savings or to pay dividends or buyback their stock, so the deficits from the Trump tax cuts and the Trump payouts to businesses at the start of the pandemic were largely offset by increases in private savings.

The spending from the $1.9 trillion Biden stimulus bill is very different; it is putting more cash in the hands of people with high marginal propensities to consume. Low and middle income people have more of their wealth in variable interest savings accounts and have fixed interest rate mortgages so the increases in interest rates will tend to increase their share of spendable income as will increased spending on infrastructure and social services. Even though budget deficits were offset by high levels of private savings in the past, as the budget deficit approaches double digits there is a risk of inflation spinning out of control. A recent survey by Ricardo Reis that he discussed in Markus Brunnermeier’s webinar, found that a significant fraction of respondents thought inflation from 2027-2032 would exceed 10%.7 These responses may be influenced by the looming budget deficits. Note that even prior to the pandemic, and the accompanied rise in the government debt, the Wharton-Penn model was forecasting deficits going to 10% of GDP by 2050.

Excess Savings and Wealth Effects

Another missing factor in the standard Phillips curve inflation forecast is excess savings. Since the start of the epidemic there has been a large increase in aggregate savings. The savings rate has returned to roughly pre-pandemic levels, but the accumulated savings has not decreased significantly. Unless precautionary savings increases, this accumulated savings will be spent, increasing demand and putting pressure on prices.

There have also been increases in the net wealth of people across the income distribution due to increases in home prices, stock market prices and bond prices. The largest component of household wealth is housing, and housing prices have been booming over the last 10+ years. The S&P total return index from end-February 2009 to March 9, 2022 is up around 650%; the NASDAQ total return index is up around 970% over the same period. Even with the correction of stock prices in recent weeks the recent performance of equities has been very strong. The prices of bonds have also risen steadily since their lows in the early 1980s. While most of these gains accrue to the wealthy, many middle income households benefit through their IRAs and pension savings that are invested in a combination of equities and bonds.

Reduction in debt service expenses have also increased the disposable income of people. Over the last few years homeowners have been able to refinance their homes at more favorable interest rates. The stimulus packages and overall increases in savings rates have resulted in reductions in credit card debt. Interest rates on that debt have also decreased. The combined effects have been that fixed interest payments as a fraction of disposable income are at all-time lows. Increases in the disposable income has the potential to increase spending and thus push up prices.

According to media accounts, the credit card companies are actively trying to increase their lending through mailings of credit cards, and cuts in interest rates. This is due in part to the better financial position of most households and also due to fewer opportunities to lend money to safe borrowers. The increased availability of credit can increase spending causing another source of upward pressure on prices.

Reductions in Labor Supply

The main change in labor supply has come from a reduction in the labor force participation rates. There has been an abnormal amount of the labor force which has retired. Wages have increased sharply in January and February of 2022. The Atlanta Fed uses a panel set of respondents to measure the change in the wages of the same people from one year to the next. This avoids changes in the labor force composition that typically underestimate wage changes as new participants tend to have lower wages. Looking at changes of the mean average wage change for the latest 3 month period compared to the wages 12 months ago, those wages are up 7.7%. The wage gain has accelerated in recent months as can be seen in the chart below.8 The wage gains are greater for higher wages workers (the average is the average of the wage gains not the average wage gain) and thus the increase in spendable income is greater than 7.7%. Wages are also truncated at the level that would generate annual income of $150,000. This truncation further reduces the average wage gain and causes the wage increase to be understated.

Distribution of Year-Over-Year Individual Wage Growth (Federal Reserve Bank of Atlanta)9

We expect that the increase in wages will have a smaller effect on the labor force participation rate of older workers than would normally be the case. There are continuing increases in the benefits from retirement versus working. For example, social security payments increased by 5.9% in January reflecting the increase in the CPI-W from the end of September 2020 through the end of September 2021. If the changes in the CPI-W from end of September to end of February were to continue at the same annualized rate, social security benefits in January 2023 would increase by 9%. The CPI-W has been increasing—it grew by 0.9% in February. Increases in social security benefits are likely to keep the transitions from retirement back to the labor force at the low levels we have observed in recent years.10 Tax brackets are linked to the Consumer Price Index for All Urban Consumers (“CPI-U”) which has also been increasing at a rapid rate (a year-on-year growth in February of 7.9%). The implied rent on owner occupied housing has been growing more slowly than other components of the CPI, thus the current cost of living is growing faster than would be indicated by the CPI number, but as rents on new leases become reflected in average rents that trend will provide an impetus for further increases in cost-of-living adjustments. Note that the Producer Price Index (“PPI”), which is the cost that firms charge for goods and services, has been increasing significantly faster than the CPI or the PCE, the latter being the main measure of inflation used by the Federal Reserve.10

Another driver of incentives to retirement is changes in the benefit from employer provided health care. Obamacare subsidies for individual health care contracts, and increased coverage of Medicaid by most states, lower the cost of retirement for people who don’t yet qualify for Medicare. We have observed that once we correct for the changes in the age distribution between the 2010 and 2020 census, the labor force participation rate of workers over 55 has continued to be significantly below its levels prior to the pandemic.12 The labor force participation rate of younger workers has almost completely recovered to its pre-Covid levels. Thus the lower labor force participation of older workers seems likely to be due to retirements or possibly to the effects of long-haul COVID and may persist. Long-haul COVID may decrease the productivity of workers and thus may reduce effective labor supply apart from its effects on employment.13

Lastly, the gains in asset values discussed as a driver of future spending and thus on inflation are not reflected in the savings data, but they increase the ability of people to support themselves through asset sales, and, thus will enable middle and higher income older workers to withdraw from the labor force without having to unduly decrease their spending. Decreases in output due to retirements that are not fully offset by decreases in spending puts upward pressure on wages and prices. As discussed above, we are already seeing higher wages in the Atlanta Fed data, which tracks the wages of the same people over a 12-month period and thus avoids the biases from changes in the composition of the labor force. Note that the media interpreted the most recent wage data as indicating a flattening in the growth of wages: this divergence can be explained by the large increase in employment in the leisure and hospitality sectors which have among the lowest wages of any sector.

Problems with the Phillips Curve Model Variables

Having presented a number of important variables that are omitted from the Phillips Curve model, I will discuss in turn each of the variables that are in the model.

Inflation as a Predictor

The various indices of inflation don’t actually do a very good job of measuring changes in the cost of living, i.e. changes in disposable income that would be needed to sustain the same standard of living. For the CPI, roughly ¼ of its weight is the implied rent of owner-occupied housing—increases in the implied rent will eventually affect the cost of living but even that effect is muted by the inheritance of dwellings by the children of the previous generation of owners. They are not paying the new higher implied rent of housing if they either live in the dwelling they inherit, or sell it for an equivalent dwelling. The PCE has a smaller but still substantial component of owner-occupied housing. It also includes the cost of medical services provided by firms. The PCE is of particular importance because it is the main measure of inflation used by the Federal Reserve in deciding on whether the economy is overheating.

Average rents, including the implicit rent on owner occupied housing, is almost 1/3 of the CPI. Rental contracts are typically of at least a year’s duration. Rents on new leases have been increasing very sharply. The effect on average rent is lagged; even if the rents on new leases were to stop increasing, average rents would increase as contracts are renewed.

The rental vacancy rate in the 4th quarter of 2021 was 5.6%, the lowest level since 1984.14 According to RealPage, the vacancy rate in November 2021 for apartments was reported even lower at approximately 2.5% and, when there is a turnover of tenants, rents increased by 13.9% as of November on a year-on-year basis.15 There have been similar increases in asking rents for new leases—Zillow and Apartment List each reported increases of well over 15% year over year by the end of 2022.16 This effect of annual or bi-annual rental contracts will provide continued pressure on inflation as measured by the CPI for many months if not years to come.

The cost of health care services is subject to agreed-upon contracts between insurers and the government on the one side and providers on the other. Since these contracts are fixed for some time period, the prices of government and insurance provided health care tend to adjust more slowly to inflationary pressures than most other services, but are likely to catch up or even exceed the price increases in other sectors.

The cost of education has also been rising more slowly than other components of the PCE. This may be due to falls in expenditures on transportation, after school activities, and substitute teachers and early retirement of more senior teachers (who are generally higher paid) due to COVID. I would expect that expenditures on education to increase post COVID.

Although rent has a smaller weight in the PCE than in the CPI, it is still substantial, and the lagged effects discussed for the CPI will also affect the PCE in future months. Unless careful and judicious adjustments are made, these lagged effects on the PCE will affect the Federal Reserve’s models of future inflation and thus may affect future interest rates as reported inflation comes in higher than would be expected if the lagged effects of increases in rents on new leases were not taken into account. While the lagged effects of rent increases are fairly predictable, there is much more uncertainty about future changes in health care and education and also more uncertainty about how Federal Reserve policy will respond to these lagged effects compared to the deterministic response of social security payments and tax brackets to changes in CPI-W and CPI-U respectively.

The trimmed inflation rate has historically been a good predictor of future inflation.17 When inflation is low prices do not change very often: this is especially true of prices of services so movements in prices by some providers can be a good indicator of future price movements by other providers. Prices of energy and food tend to respond very quickly to changes in supply and thus are unlikely to exhibit these lagged effects, which may be why the Phillips curve models have traditionally focused on core inflation, which excludes energy and food prices. (The conventional argument for excluding energy and food prices is that they are volatile, this may just mean that imbalances in the supply/demand for energy or food have immediate effects on prices and thus are not predictive of future price changes).

When inflation is high, prices change more frequently, which changes the relationship between current inflation and future inflation. At low rates of inflation people don’t expect price changes and thus will be sensitive to them, making prices sticky—they are more likely to search for another supplier than when prices are regularly increasing. At moderate rates of inflation such as we are currently experiencing people are accustomed to price increases and firms can increase prices without having the same effects on their customers and customer loyalty as when the customers are accustomed to rigid prices. When inflation gets very high firms can index prices, wages, rents and other long-term contracts to measures of inflation. With full indexing there is almost no lag between current price increases and future price increases.

Except for social security payments and various inflation indexed securities, we have very little indexing in the current economy. Thus the lengths of lags are important particularly for the rental and health care components of the price indices. The very large increases in rents on new leases will continue to have large lagged effects on average rents as used in the CPI. As discussed above, there are also lagged effects from health insurance contracts that tend to only be repriced annually. Although health costs are not rising rapidly, the ratio of employees in medical services to revenues has fallen dramatically which seems likely to result in higher wages and higher health costs in the future, these effects impact future inflation as medical service contracts get signed at higher costs. If we are going to use current inflation as a predictor we should consider the details. In particular if we want to predict the inflation as measured by the CPI or PCE, then instead of using average rents in the inflation component of the Phillips curve we should be using rents on new leases.

We should also adjust current measures of inflation to reflect quantity rationing: the “price” of a good or service that is not currently available is somewhat meaningless. Since the CPI uses past purchases as weights, this distortion can be significant (the PCE is a chained linked index which mitigates, but does not eliminate this problem). Of course, we can’t get precise measures of the shadow price of these rationed goods and services, but a precise measure of a meaningless number is not very useful. Similarly, shortages of glass or of wiring harnesses from Ukraine or platinum or nickel from Russia may limit production of some cars or other goods, creating a reservoir of unfilled demand that will put pressure on prices in the future.

Inflation as measured by the PCE (which is a national price index) has other measurement issues under current conditions. It gives biased measures of supply/demand imbalances when there is large scale migration from high-cost regions (urban centers in California and the Northeast) to lower cost regions of the economy (such as rural areas, exurbs, and states with lower cost of living). Prices in both cities and rural areas could be increasing and inflation as measured by the PCE falling, if the local price increases was outweighed by a larger share of consumption occurring in lower cost locations. While, this scenario is highly unlikely, migration effects do cause the PCE to under-estimate the inflation experienced by individuals who do not migrate, and the people migrating are presumably closer to indifferent between living in the high-cost urban area versus low-cost rural areas or southern states. There is another effect which is that the cost-of-living indices are not fully capturing changes in the prices of goods and services purchased by very wealthy people which could eventually be reflected in increased purchasing power and increased purchases by the providers of those goods and services.

Inflationary Expectations

Expectations of future inflation is usually estimated using consumer survey data18 or using the data from the market for TIPS.19 The simplistic model of inflation expectations is that when people expect there to be inflation, they will buy today in anticipation of prices being higher tomorrow. Likewise, firms will invest more in inventory today and parts to get ahead of future price increases, and be willing to pay higher wages today because they think they will sell their goods for more tomorrow. Unions will negotiate for higher wage increases to compensate for future price increases. To the extent that older workers anticipate increases in their social security benefits due to cost-of-living adjustments, firms will be incentivized to increase their wages today.

While the simplistic dynamic may hold some of the time, it does not take into account people’s anticipation of Fed policy in response to higher inflation. If a high level of expected inflation is associated with a greater probability of a recession due either to contractionary monetary policy or Minsky effects of excessive risk-taking during booms, it may be rational for firms and consumers to reduce their risk exposure when they anticipate high inflation.

A reasonable response by consumers is to increase savings rates and to defer purchases of consumer durables, especially ones which decrease future disposable income.20 Yuriy Gorodnichenko has found that consumers in the U.S. and elsewhere associate high inflation with falls in GDP, and that in a randomized control trial, when consumers were given data that lead them to increase their inflation expectations, they reduced spending on durables.

Even if consumers are uncertain about whether inflation will lead to a Fed induced recession versus a price increase without a recession, a risk averse consumer would still increase savings if they think the probability of a recession is higher.

The effects for producers are similar: they may be reluctant to make investments if they think the probability of a Fed induced recession is higher when expected inflation is higher.

Potential buyers of bonds may anticipate higher interest rates as the Fed tightens in response to inflation. They would then demand higher interest rates today, pushing up the cost of borrowing for firms. The higher borrowing costs will decrease investment thus decreasing demand and lowering prices. Potential buyers of bonds may also demand a higher risk premium due to the increased risk of a Fed induced recession that would cause a higher rate of default on bonds. Higher interest rates may increase defaults by marginal firms even in the absence of a recession. Firms that can’t get financing are likely to curtail investment and hiring thus decreasing aggregate demand.

In summary, counter to the usual logic that anticipation of higher prices and interest rates causes an increase in spending, it could instead decrease spending. I’m not arguing that when expected inflation will increase that spending will contract and thus the economy automatically stabilizes. What I am suggesting is that the response of consumers and firms to higher rates of expected inflation could vary widely depending on how they believe the Federal Reserve will respond and how they believe other firms and consumers are likely to change their behavior in response to higher expected rates of inflation. Historical data may not be very informative in estimating the coefficient of expected inflation in the Phillips curve.

Slack in the Economy as Reflected in the Difference Between Unemployment and the Natural Rate of Unemployment

Most inflation forecasting models assume a natural rate of unemployment of 4%. This is below the unemployment level for almost every month pre-pandemic in the last 20+ years. The natural rate of unemployment is driven by job searching and, as such, is mainly a function of the fraction of young adults and teenagers in the labor force. Unemployment rates fall very sharply going from the 16-21 age group to the over-30 age group. The retirement of older workers increases the percentage of young workers and, thus, increases the natural rate. Thus, even if you believe the difference between the unemployment rate and the natural rate of unemployment is the best indicator of slack in the economy and of future wage growth then if we adjust the natural rate of unemployment, we would find that there is much less slack than would be suggested by assuming the natural rate of unemployment is 4%.

However, I think that the difference between the unemployment rate and the natural rate of unemployment is a poor estimate of labor market tightness and overall slack. Job openings or alternatively quits have each been far better predictors of inflation than is the difference between unemployment and the natural rate of unemployment.21 In my discussions with macroeconomists, the argument for using the divergence of unemployment from the natural rate as a measure of slack in the economy is that we don’t have data on job openings or quits going back past 2000. I don’t think that is a very good argument for ignoring all recent data on job openings and quits.

The measures presented by the Atlanta Fed indicate historically high levels of labor market tightness—in many cases the labor tightness measures are at, or close to, the maximum level in the data.22

The private sector job vacancy rate to private sector employment is roughly twice its long run average since 2000 and every month since February 2021 has been higher than in any month prior to February 2021 since records began in 2000. Similarly, over the last year, private sector job vacancies and private sector quit rates have been steadily above the levels seen prior to the pandemic and are well above their long-run averages.

It seems reasonable to expect that employers are going to raise wages if they can’t retain their current workers or fill vacancies, and that this would be a more pressing concern than the unemployment rate. The unemployment rate is affected by the age distribution of the labor force composition, accumulated savings, two earner households and other factors that do not directly affect the incentives for firms to increase wages.

A key metric of the labor market that will affect aggregate demand as well as the marginal cost of supplying goods and services is the change in wages, holding the composition of the labor force fixed. As previously discussed, workers are experiencing greater wage increases than would be inferred from the numbers reported in the media.

Comments on the Ability of the Fed to Address Inflation

Sensitivity of Employment to Changes in Interest rates: U.S. Car Production

Moderate increases in interest rates have their effects through changes in employment in the automobile industry and the residential construction industry—both of which are highly sensitive to interest rates. U.S. car production ranged between 8 million and 10 million cars per year prior to the pandemic. Production of motor vehicles was close to 10 million in the period before the Fed slammed on the breaks in the late 1970s. The increases in interest rates by the Volker Fed led to a fall in U.S. car production to 4 million cars per year. Currently, U.S. auto production is below 2 million cars per year. U.S. Automotive manufacturing sales are estimated to be around $86 billion in 2022.23 This is comparable in order of magnitude to the increase in payments to social security recipients from the cost-of living adjustment in January and the expected adjustment next January. Automotive manufacturing is a much less important contributor to the U.S. economy than it was in the past. It is currently the 136th largest industry in the U.S., and the 13th largest manufacturing industry.24 We don’t have comparable data from the 1970s, but automobile manufacturing was probably the largest manufacturing industry at that time. The decrease in the importance of automobile manufacturing in the U.S. economy is due in part to the longer use value of cars caused by higher quality (the average car in the U.S. is currently expected to stay in use for 20 years) and an increase in imports as a fraction of total sales.

Residential Housing

Turning now to residential housing, the other industry in which historically interest rates have had a major impact. This industry has not fallen as a share of GDP so a crash in housing starts would have a large impact on total demand. However, there are some peculiar features of the recent housing market. Despite the large increase in home prices, housing starts have not increased very much at around 1.7 million. As a fraction of the working age population, housing starts are well below their long run average—they are following an upward trend after falling sharply after the great financial crisis.25 If we consider vacancies plus homes under construction as a fraction of adults under 25 living with their parents, this ratio has been hovering around its historical low indicating large unfilled demand for housing.

Ratio of Housing Units Vacant and in Construction to Young Adults 16-25 Living with a Parent26

The lack of an increase in housing starts, despite the increase in housing prices and the increase in rents, seems likely to be due to the sharp increase in the cost of construction that has accompanied the increase in housing prices. I would expect that the fall in demand for housing from an increase in interest rates is likely to be mitigated by a fall in the prices of the inputs to construction. There are high job vacancy rates in the construction industry so even if demand for housing were to fall it is not clear that there would be major reductions in employment in the housing sector. Furthermore, there is likely to be increased demand for construction workers from the infrastructure bill. Thus, it seems as though the effect of moderate increases of interest rates on employment in the construction industry may be to merely offset the demand for construction workers from the $500 billion in spending in the infrastructure bill.

The bottom line is that it seems unlikely that the contemplated increases in interest rates will be sufficient to bring inflation down to the levels assumed by market participants. The Federal Reserve can crush inflation if it takes interest rates high enough, but it may need to go to levels of interest rates that are not politically feasible due to the effects on bankruptcies of small and medium sized business that finance themselves through variable interest rate bank loans.

Data That May Cause My Predictions to Be Wrong

The following could derail my predictions. They can be grouped into two broad categories: factors that could increase private savings and thus dampen demand, and factors that could increase output and thus increase supply.

  • The fear of future pandemics, or civil unrest around the 2024 election could lead to high levels of private savings, and especially savings in safe assets such as treasuries or TIPS. This high savings rates could decrease demand.
  • A fear that when the Medicare and social security trust funds run out of money, benefits will be cut, which could lead to large increases in precautionary savings.
  • The income distribution could get even more unequal with more of the income going to people with high savings rates.
  • A fear that the Federal Reserve will raise interest rates to levels that will cause massive job losses and business failures could lead to high savings rates by individuals and firms and lower demand.
  • Events in Ukraine increasing risk aversion and flight to safety pushing up savings rates and lowering interest rates on government bonds.
  • Fed Policy triggering a recession
  • Increased life expectancy of high-income individuals and increased incidence of costly age-related diseases as people live longer will cause high income people to increase their savings rates. These same factors could cause high income, high productivity people to remain in the labor force for longer, thus increasing labor supply.
  • After the pandemic subsides, retirees could rejoin the labor force thus decreasing the vacancy rates.
  • Immigration policy could change to allow in more productive workers, thus increasing labor supply.
  • Over the course of the next few years, increased use of self-driving trucks, use of drones for deliveries, and more use of robots in warehouses could alleviate pressures on labor supply and enable more efficient allocations of resources.
  • A strong dollar perhaps due to higher interest rates or to a flight to safety from events in Ukraine could lower the price of imports of goods and services.

Summary

There is considerable uncertainty about future inflation, but the standard models are seriously flawed, and even the more sophisticated models do not seem to adequately capture the risk of extreme events. They are explicitly assuming either normal distributions or log normal distributions, while the historical distributions typically have high degrees of kurtosis, and, at least for interest rates, skewness is inherent in any model with high variance and interest rates being bounded somewhere above -1%.

I would urge caution in buying any assets that are vulnerable to high nominal interest rates. I would also urge caution in not assuming a Normal (bell shaped) probability distribution of future interest rates or inflation (very high nominal interest rates are more likely than very negative ones). I’d also urge caution in assuming that the Federal Reserve will be able to hit its inflation target of 2%. I hope it can, but would not bet on it.


Sincerely,

Andrew Weiss  |  CEO, Weiss Asset Management


Disclaimers:

This commentary has been prepared by Dr. Andrew Weiss and reflects the opinions of Dr. Weiss. This is not an offer to sell, nor a solicitation of an offer to buy any security of any fund (a “Fund”) managed by Weiss Asset Management LP or its affiliates (“WAM”) or any other investment product or strategy.  Offers to sell or solicitations to invest in a Fund are made only by means of a confidential offering memorandum and in accordance with applicable securities laws.  An investment in a Fund involves a high degree of risk and is suitable only for sophisticated investors that are qualified to invest therein. Commodity trading involves a substantial risk of loss.

This commentary may not be reproduced or further distributed without the written permission of Dr. Weiss.  This material has been prepared from original sources and data believed to be reliable.  However, no representations are made as to the accuracy or completeness thereof.

Although not generally stated throughout, this commentary reflects the opinion of Dr. Weiss, which opinion is subject to change and neither Dr. Weiss nor WAM shall have any obligation to inform you of any such changes.

This commentary includes forward-looking statements, including projections of future economic conditions. Neither Dr. Weiss nor WAM makes any representation, warranty, guaranty or other assurance whatsoever that any of such forward-looking statements will prove to be accurate.  There is a substantial likelihood that at least some, if not all, of the forward-looking statements included in this commentary will prove to be inaccurate, possibly to a significant degree.